
Environment and Energy
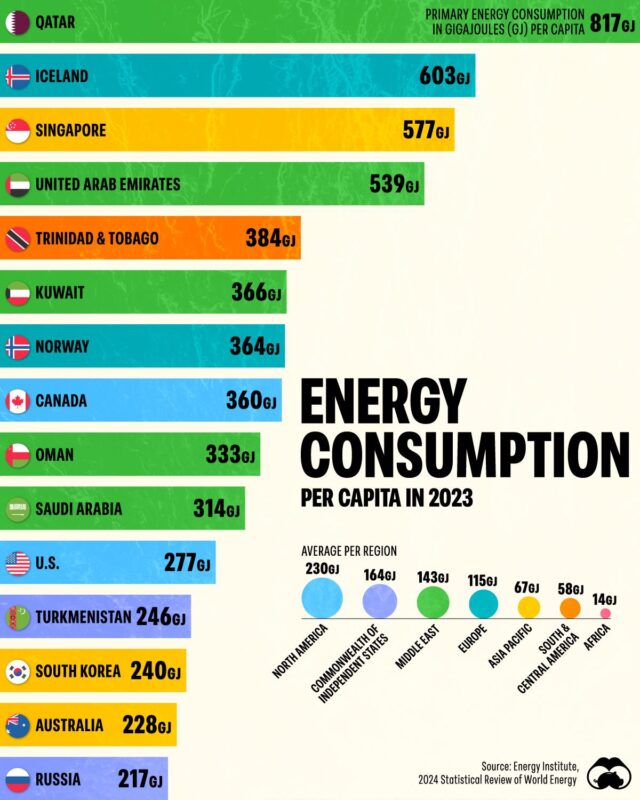
Energy Consumption per Capita in 2023, Top 15 Countries
This Visual Capitalist chart ranks the top 15 countries and compares regions, from North America at 230 GJ per person to Africa at 14 GJ, using Energy…
476 reviewed infographics. Search them, or narrow the list by topic and sort it the way you want.
This Visual Capitalist chart ranks the top 15 countries and compares regions, from North America at 230 GJ per person to Africa at 14 GJ, using Energy…
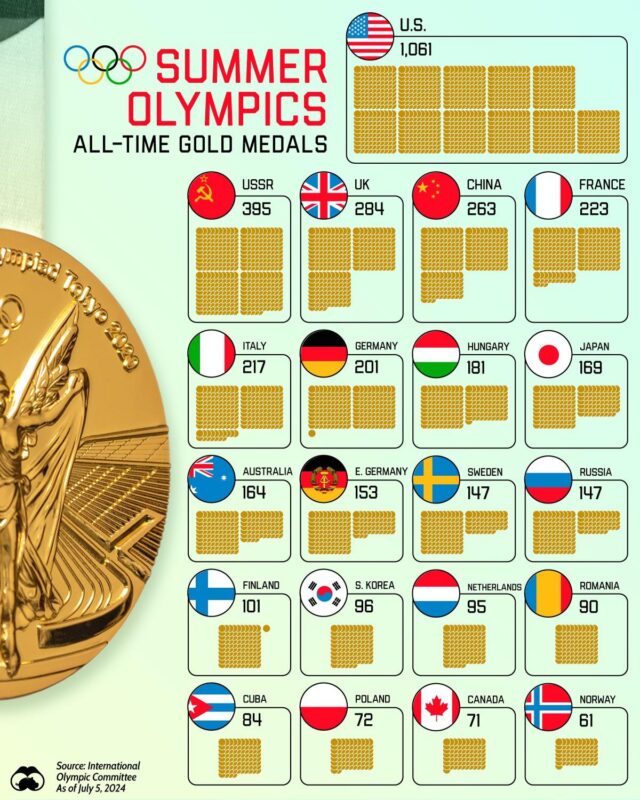
The US leads with 1,061 golds, far ahead of the Soviet Union (395), the UK (284) and China (263).

France collects the most tax relative to its economy, 46% of GDP, followed by Italy and Germany.

In an Ipsos survey of 23,721 adults, 51% expected a stronger global economy than in 2024 and 49% a weaker one.
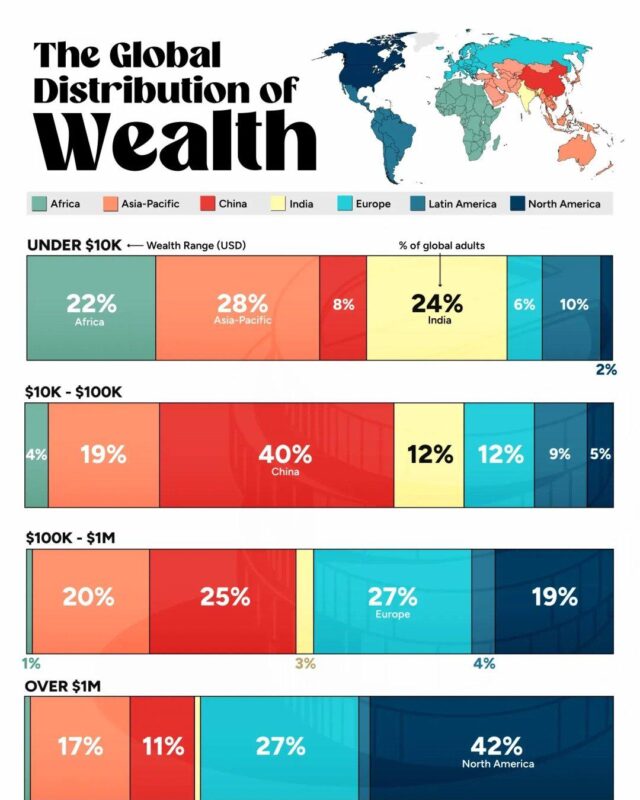
North America is home to 42% of the world's adults with more than $1 million, while Africa, Asia-Pacific and India together account for 74% of adults with…

The USA gave the most, $1.0 billion (15.6%), followed by the Gates Foundation ($826 million) and Germany ($723 million).

Walmart leads at $648 billion, followed by Amazon and China's State Grid.

The United States holds $11.8 trillion, close to half, followed by Japan with $2.1 trillion and Canada with $1.8 trillion.

Hawaii is highest at about $259,000, followed by Massachusetts and California, while West Virginia is lowest at about $82,000.

Oslo ranks first with 8.06 out of 10, Sofia and Athens follow, London is sixth, and Budapest is last on 3.13.

Washington, D.C. is longest at 5 hours 14 minutes and North Dakota shortest at 1 hour 50 minutes.
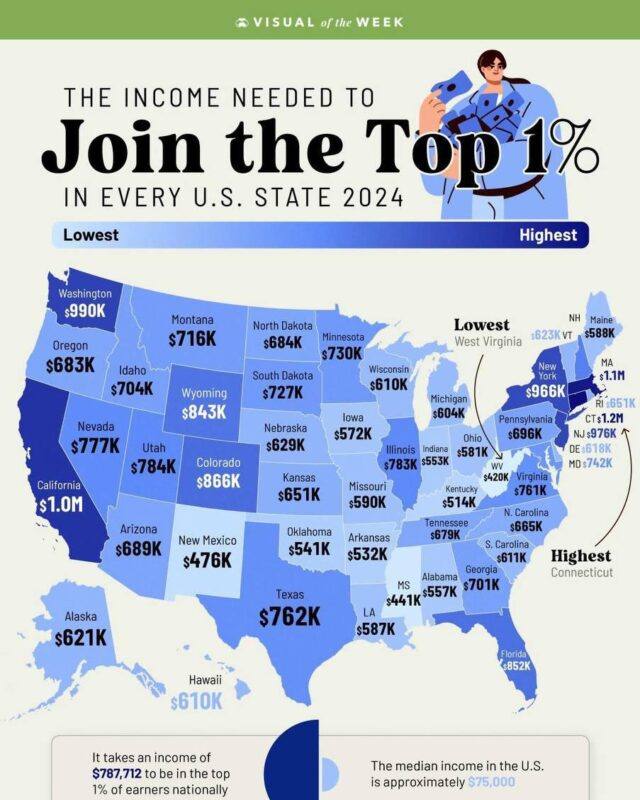
Nationally it takes $787,712 to join the top 1% of earners.

Exports to the top three alone supported more than 4 million US jobs.
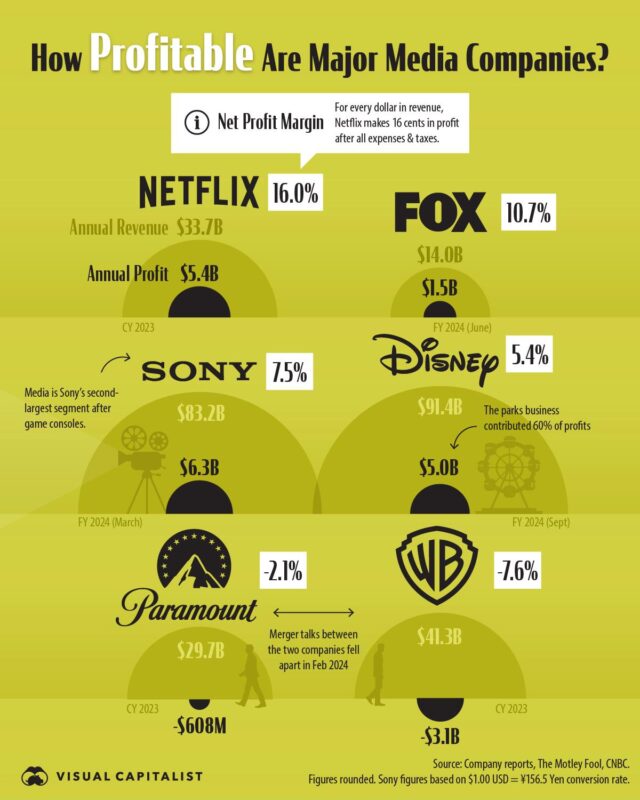
Netflix leads at 16.0%, making 16 cents of profit per dollar of revenue, ahead of Fox, Sony and Disney.
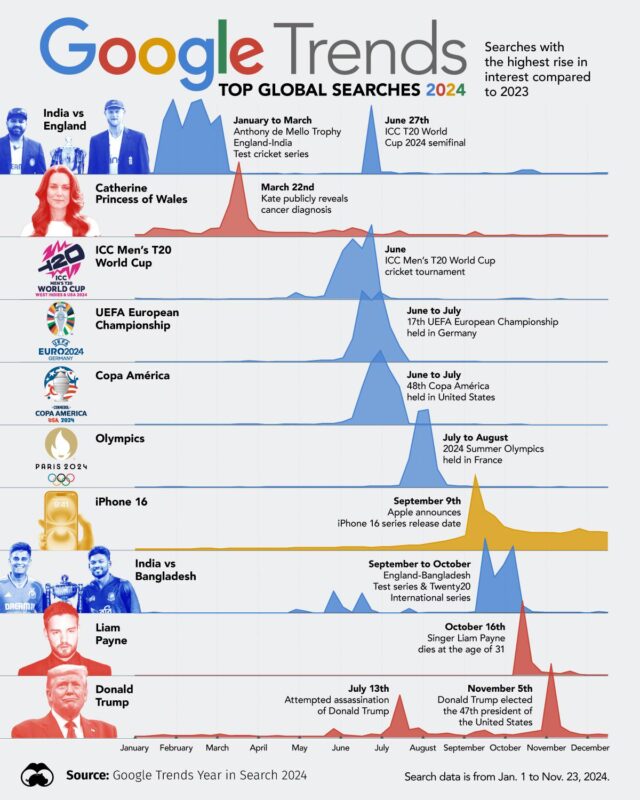
Six are sports events, led by Copa América, the UEFA European Championship and the ICC Men's T20 World Cup.
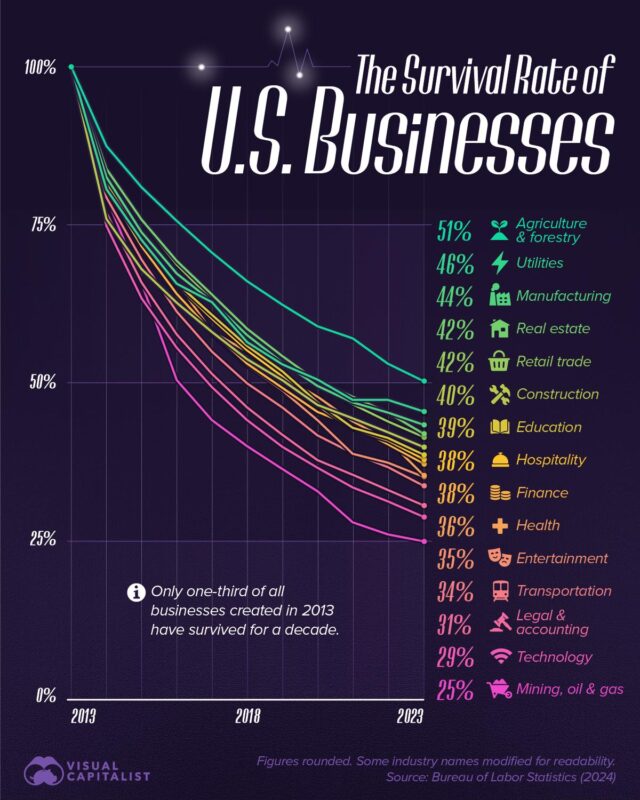
Agriculture and forestry held up best, with 51% surviving to 2023, while mining, oil and gas fared worst at 25%.
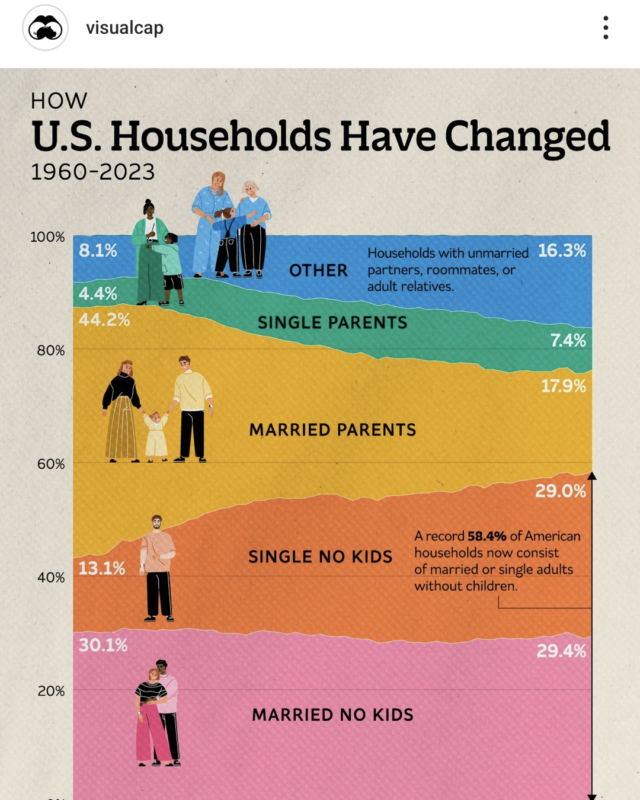
Married couples with children fell from 44.2% of households to 17.9%, while single adults without children rose from 13.1% to 29.0%.

The United States ($30.3 trillion) and China ($19.5 trillion) make up about 43% of the total, followed by Germany, Japan and India, while all of Africa…

It adds the top 10 historic events each generation named in a 2016 Pew Research Center survey.
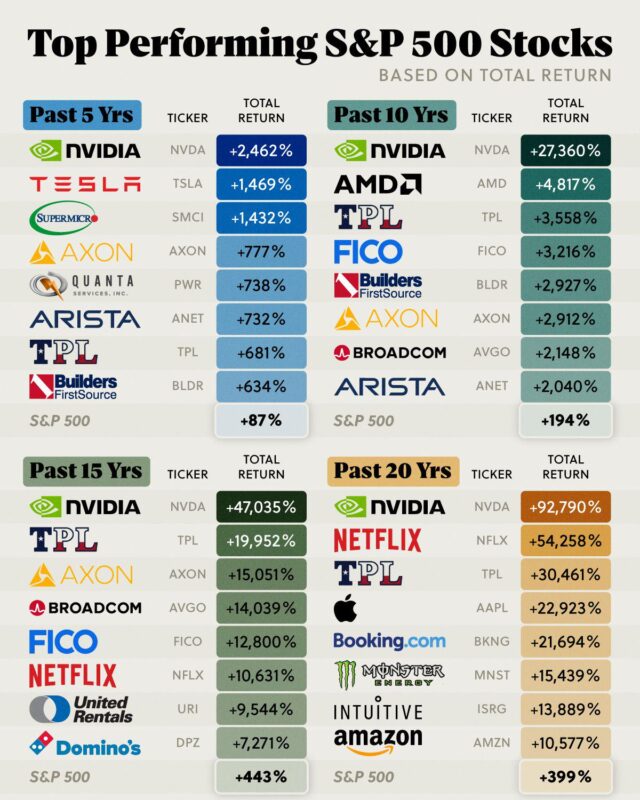
NVIDIA leads every period, up 92,790% over 20 years against 399% for the S&P 500.
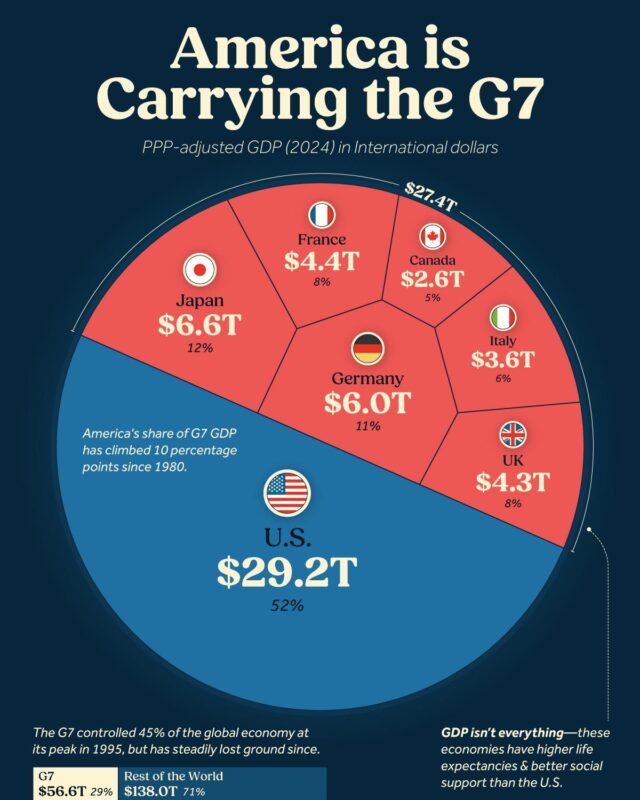
The United States accounts for $29.2 trillion, 52% of the group's $56.6 trillion, more than Japan, Germany, France, the UK, Italy and Canada combined.
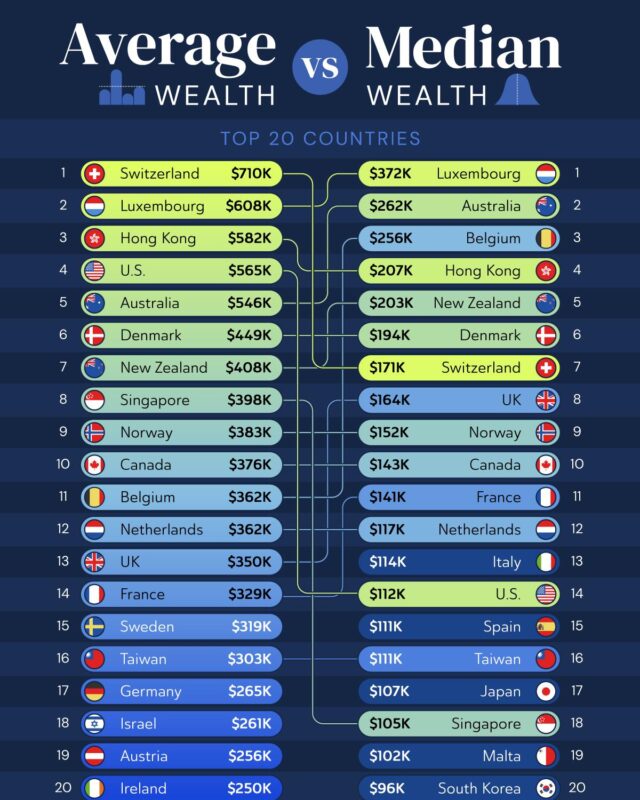
Luxembourg leads on median wealth at $372,000 per adult, while Switzerland leads on average wealth at $710,000.
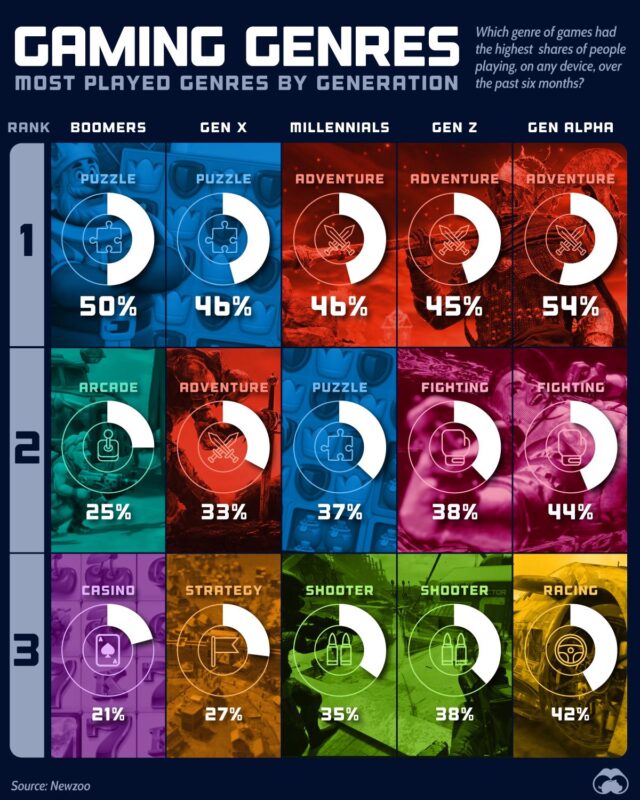
Puzzle games are the most played genre for Baby Boomers (50%) and Gen X (46%), while adventure games lead for Millennials, Gen Z and Gen Alpha, peaking at…
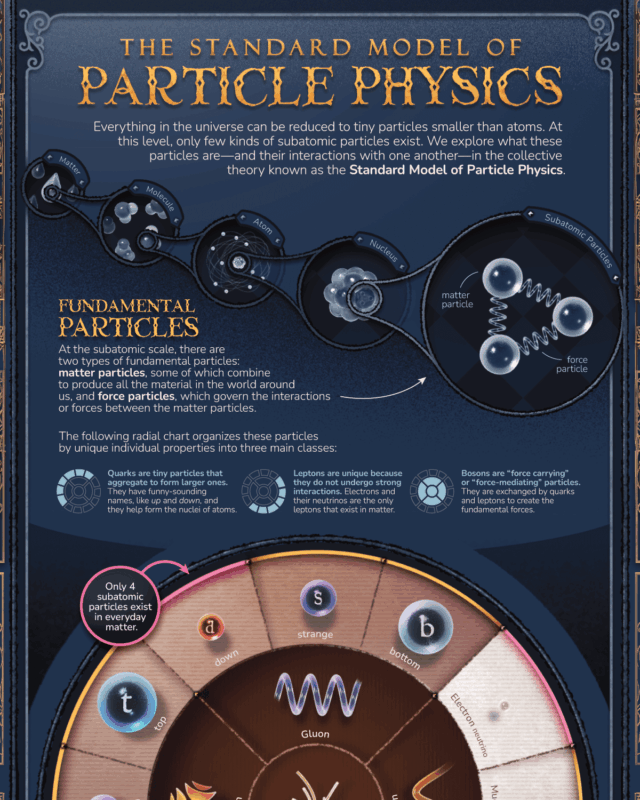
This Standard Model of particle physics poster from Visual Capitalist arranges the 17 fundamental particles on a radial chart: six quarks, six leptons and…
Every topic page starts with a short guide to the subject.







Give it a permanent page where people looking for your subject find it, with your name and a link to your site. Content marketers, agencies, designers and researchers all list here.