Finance and Economy
UK Biggest Trading Partners, Exports and Imports by Country
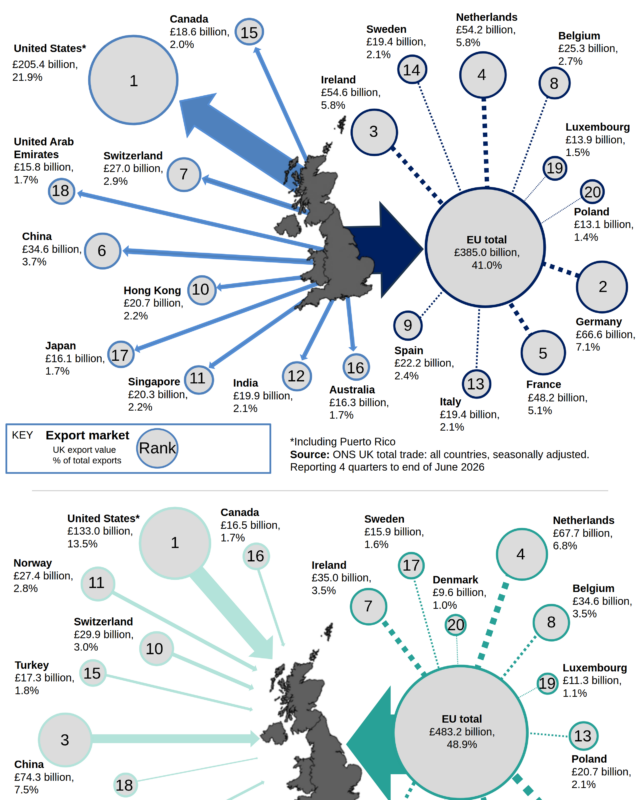
In the 12 months to June 2026 the UK exported £205.4 billion of goods and services to the US and imported £133.0 billion from it.
489 reviewed infographics. Search them, or narrow the list by topic or type and sort it the way you want.
In the 12 months to June 2026 the UK exported £205.4 billion of goods and services to the US and imported £133.0 billion from it.
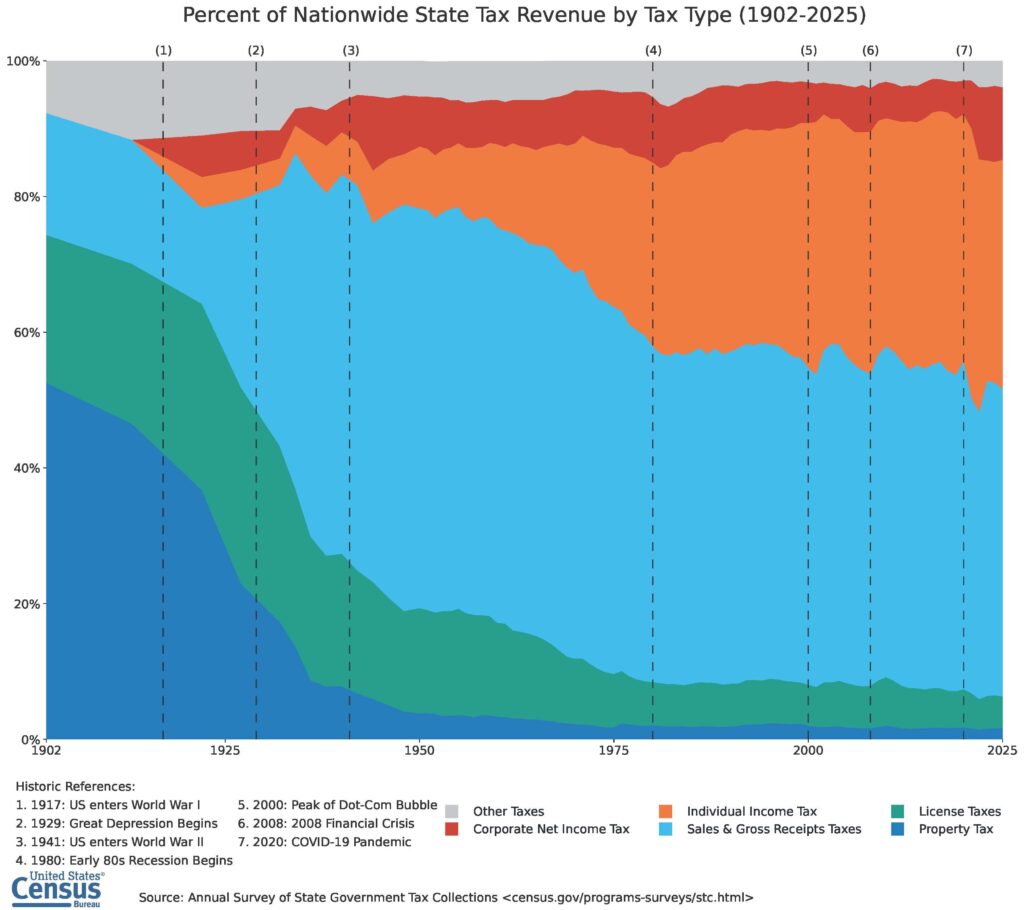
Sales and gross receipts taxes brought in 45.4% of it and individual income tax 33.7%.
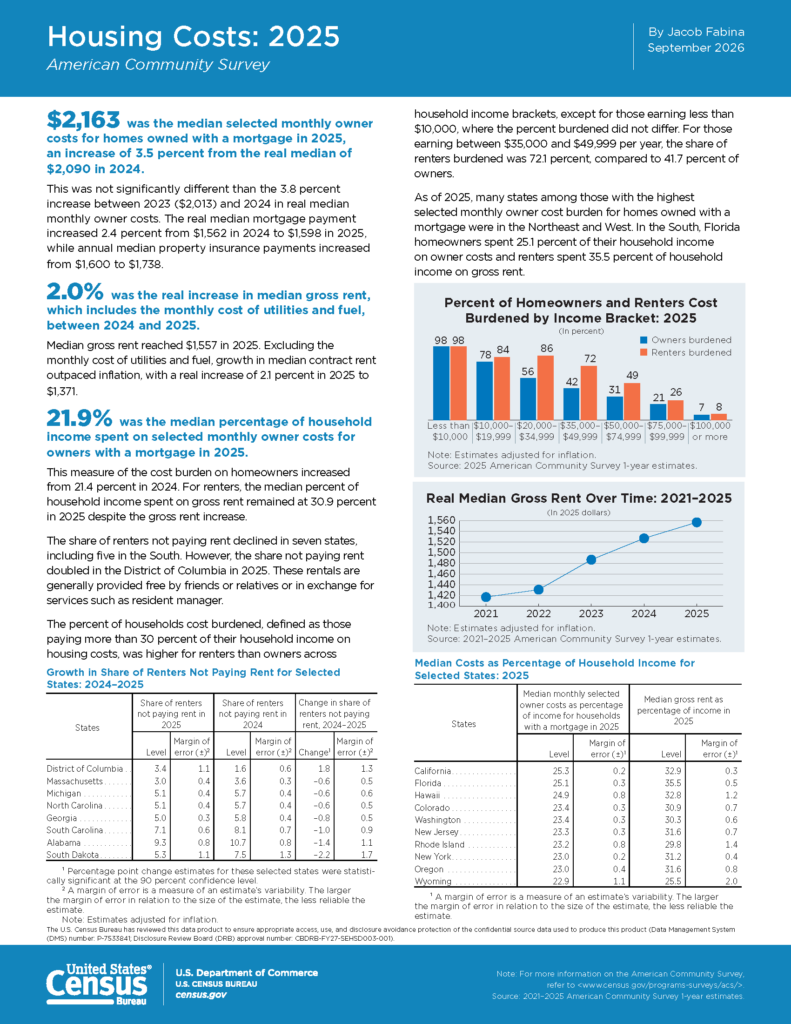
Owners who have paid off their home paid $703.

Pay is highest in Putrajaya, Kuala Lumpur and Selangor and lowest in Kelantan, where the median was RM1,860.

Across the 38 OECD countries it averaged 34.1% in 2024, the highest level on record, according to OECD Revenue Statistics 2025.

Across the US a typical home cost about 4.8 years of per person income in 2025, and the cheapest states to buy in are in Appalachia, the Midwest, the Plains…
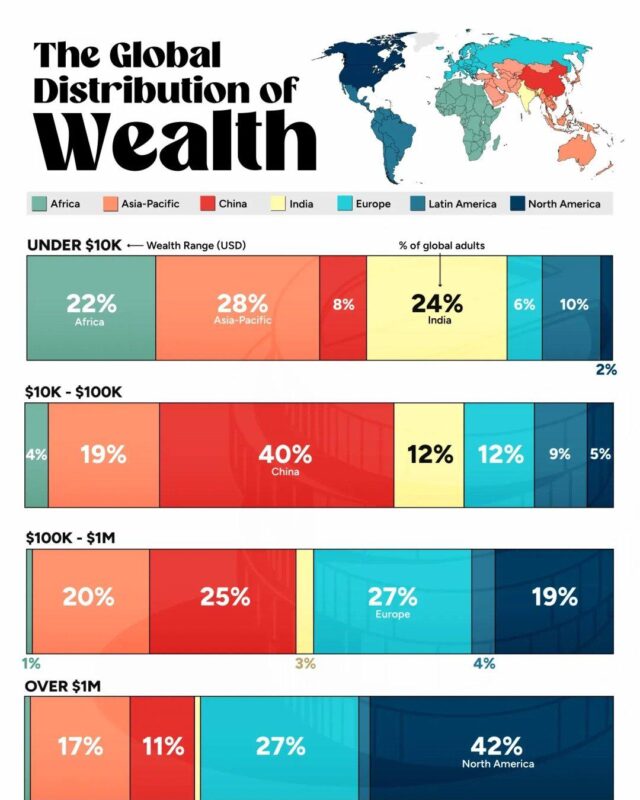
UBS's Global Wealth Report 2026 finds that the 1.5% of adults with more than $1 million own 48.4% of personal wealth, while the 42.1% with less than $10,000…

In 2024 China bought 4,057 million barrels of crude, about 11.1 million barrels a day, and Russia supplied 803 million barrels, 19.8% of the total.

Its public pension funds held $11.8 trillion in January 2025, according to Global SWF, close to half of the $25 trillion held by public pension funds worldwide.

In 26 states a family of two adults and two children needs $100,000 or more, and the average across the country is about $121,000.
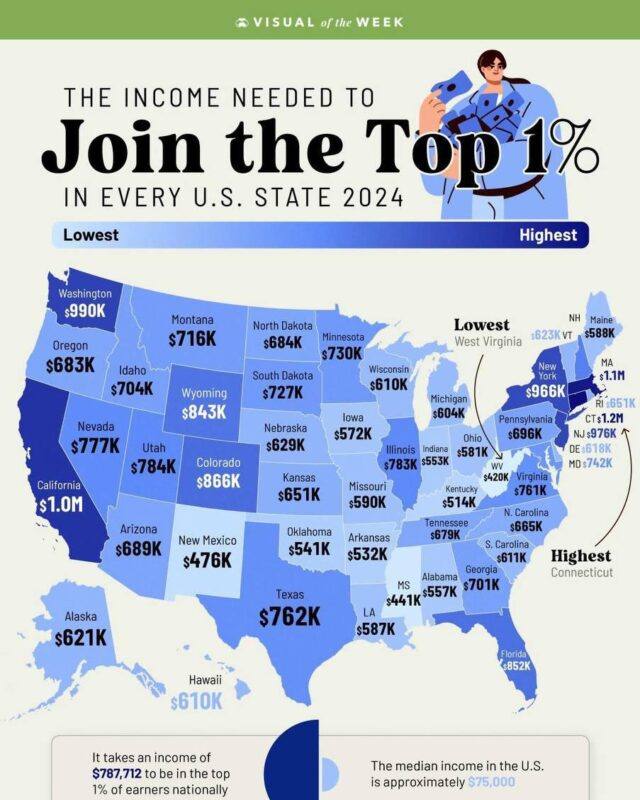
It varies widely by state, from $1,152,254 in Connecticut to $420,453 in West Virginia.

In OECD data for 2024, the countries with the highest average wages, such as Luxembourg, Switzerland, Denmark and Germany, work some of the shortest years,…

On Eurostat's 2025 figures, 93.8% of people in Slovakia live in a home their household owns, followed by Romania at 93.2% and Croatia at 91.4%.

It exported $168 billion of food in 2023 on World Trade Organization figures, ahead of Brazil at $143 billion, the Netherlands at $118 billion and Germany…

In 2024 İstanbul had the highest GDP per capita of Turkey's 81 provinces, at about $24,450, while Şanlıurfa had about $5,730, less than a quarter as much.

It exported $121 billion of medicines and pharmaceutical products in 2023 on WTO figures, ahead of Switzerland at $100 billion and the United States at $93…
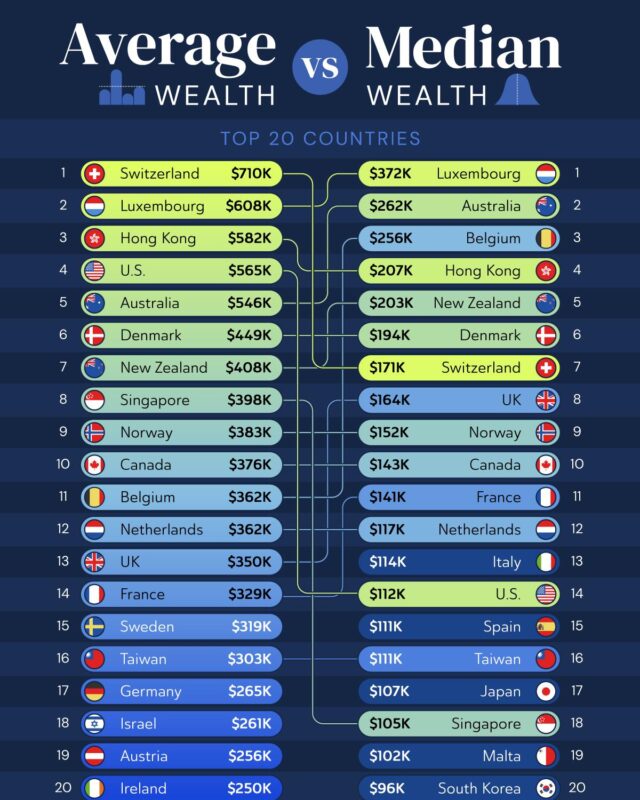
Switzerland has the highest average wealth, at about $910,000 per adult, but is only eighth for median wealth.

The national figure is 4.6, which means a typical US home costs about four and a half years of a typical household's gross income.

Energy Information Administration figures, followed by Saudi Arabia with 267 billion and Iran with 209 billion.
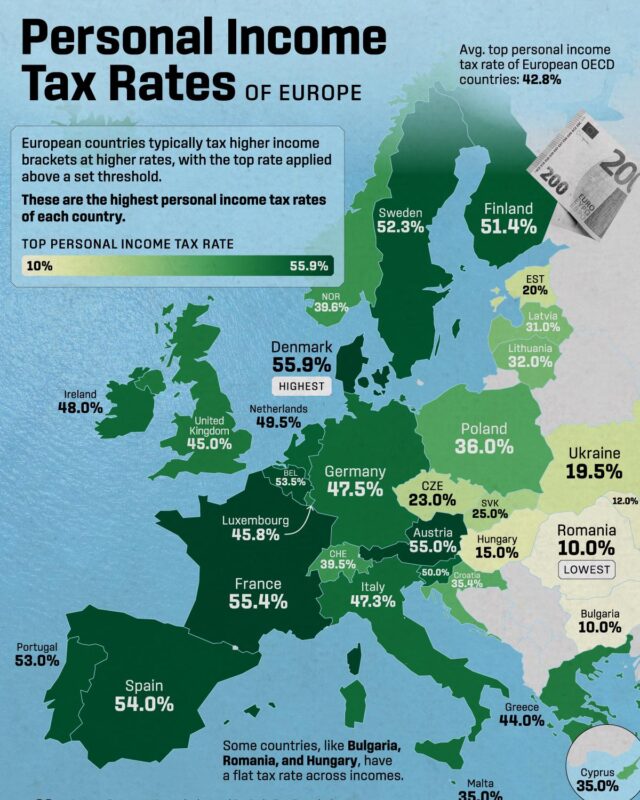
Denmark has the highest top rate of income tax at 60.5% in 2026, Belgium takes the most from an average worker's pay at 50.8%, and Hungary charges the…

In 2025 the median household in Massachusetts had $118,500 a year, about twice the $57,840 in Mississippi, against a US median of $87,460.

This Visual Capitalist map shows the 2024 figures, when the range was $178K to $301K.

In 2025 ten countries were net contributors, led by Germany at about 21.8 billion euros, while Romania, Poland and Belgium were the largest net beneficiaries.

This world trade infographic by Econovis shows how much each country relies on services: Luxembourg (90%), Malta (88%) and the Bahamas (86%) most, big goods…
Every topic page starts with a short guide to the subject.