Finance and Economy
China M2 vs US M2, Broad Money Supply From 2000 to 2024
At the end of September 2026 China's broad money stood at RMB359.63 trillion, about $53.6 trillion at the Federal Reserve's average exchange rate for that…
489 reviewed infographics. Search them, or narrow the list by topic or type and sort it the way you want.
At the end of September 2026 China's broad money stood at RMB359.63 trillion, about $53.6 trillion at the Federal Reserve's average exchange rate for that…

Russia is the largest supplier, sending 2.19 million barrels a day in 2024, ahead of Saudi Arabia, Malaysia and Iraq.

It supplied about 72% of real GDP growth from 1990 to 2024 and added to growth in 33 of those 35 years.

Bank of America is second at about $350 billion, followed by Morgan Stanley ($298 billion), Goldman Sachs ($267 billion), Wells Fargo ($258 billion) and…

Europe had half of world trade in 1970, but Asia has grown far faster and has been the biggest trading region since 2010, with about 39% of the total in…

The seven biggest US tech companies, known as the Magnificent Seven, were worth about $1.1 trillion together at the end of 2012 and $17.6 trillion at the…

In 2023 fuels and related products, mostly crude oil and gas, earned $247 billion, precious metals and stones such as gold, platinum and diamonds $127…

That was a $1,259.6 billion deficit in goods, partly offset by a $327.7 billion surplus in services.

European Union exports to the US came to €554.7 billion of goods in 2025, about 21% of everything the EU sells outside the bloc, which makes the US its…

That is about 41% below the record of $4.28 trillion set in October 2025.

It has grown about 13 times over since then and hit a record $1,259.6 billion in 2025, with big falls only in recessions.

M2 stood at $23.41 trillion in September 2026, a record high, after rising 5.7% over the previous 12 months, according to Federal Reserve data published on…

Zillow puts the typical US home at $366,157 in September 2026, up from $122,626 in January 2000, after a boom to 2007, a crash of about 24% to 2012 and a…
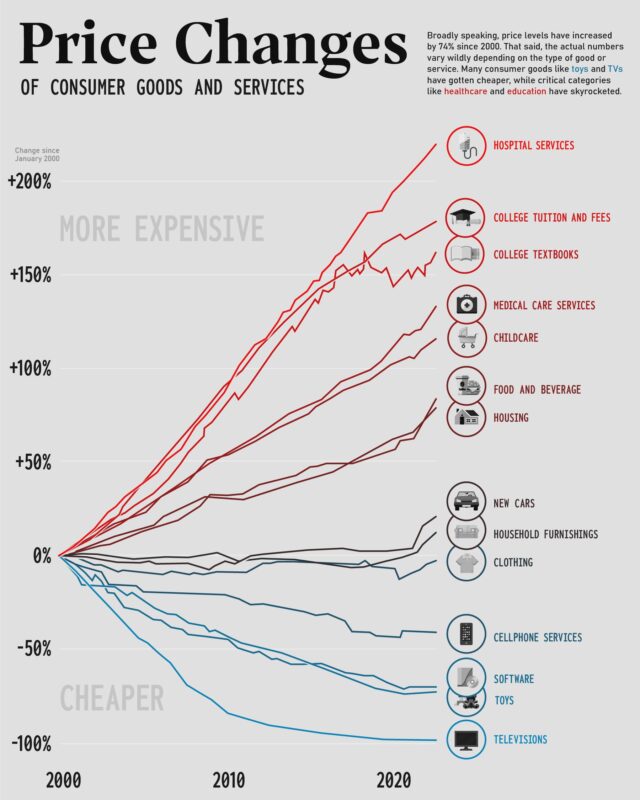
Services rose much faster: hospital services by 295%, college tuition by 208% and childcare by 166%.

Since 1960 it has averaged about 21 barrels, ranging from under 7 in June 2008 to about 80 in April 2020.
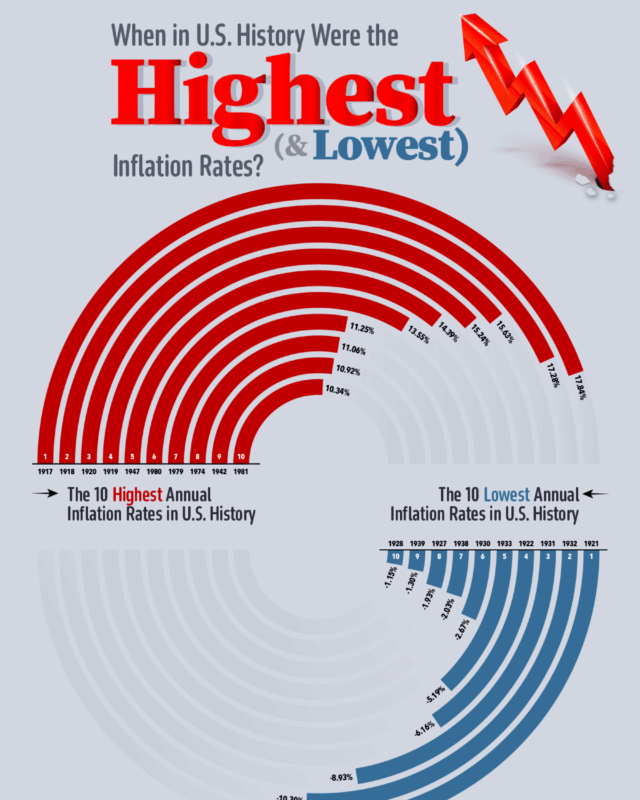
Prices rose fastest during and just after the First World War, peaking at 17.8% in 1917, and fell fastest in the slump of 1921 (minus 10.9%) and the Great…

Since 1989 the top 1% share has risen from 22.8%, and stocks have grown from 10% to 28% of what Americans own.

The shares were priced at $34 on 20 March, valuing the company at about $6.4 billion, and began trading on the New York Stock Exchange as RDDT on 21 March.
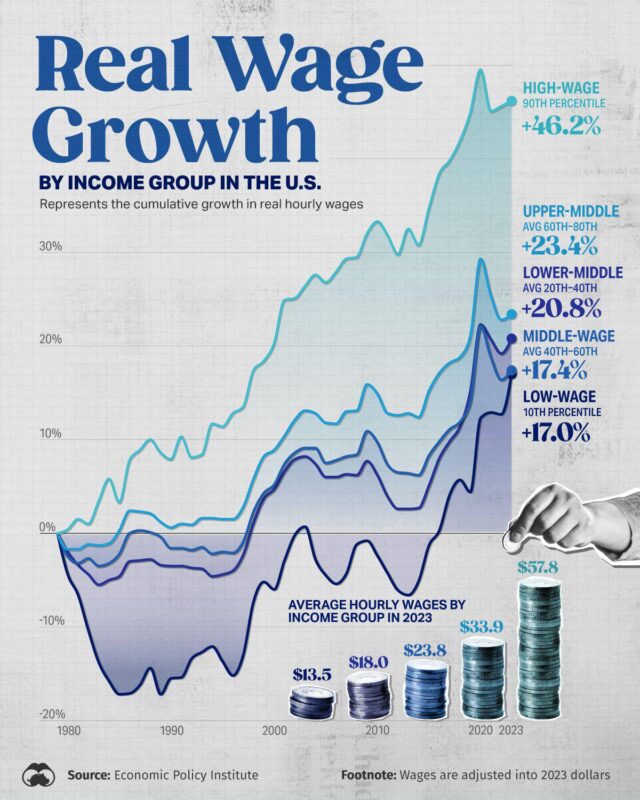
Over the long run every income group is better off than in 1979, but very unevenly.
Every topic page starts with a short guide to the subject.