

Finance and Economy
China Oil Imports by Country, Crude Oil Sources in 2024
China bought 4,057 million barrels of crude that year, about 11.1 million barrels a day.
471 reviewed infographics. Search them, or narrow the list by topic and sort it the way you want.
China bought 4,057 million barrels of crude that year, about 11.1 million barrels a day.
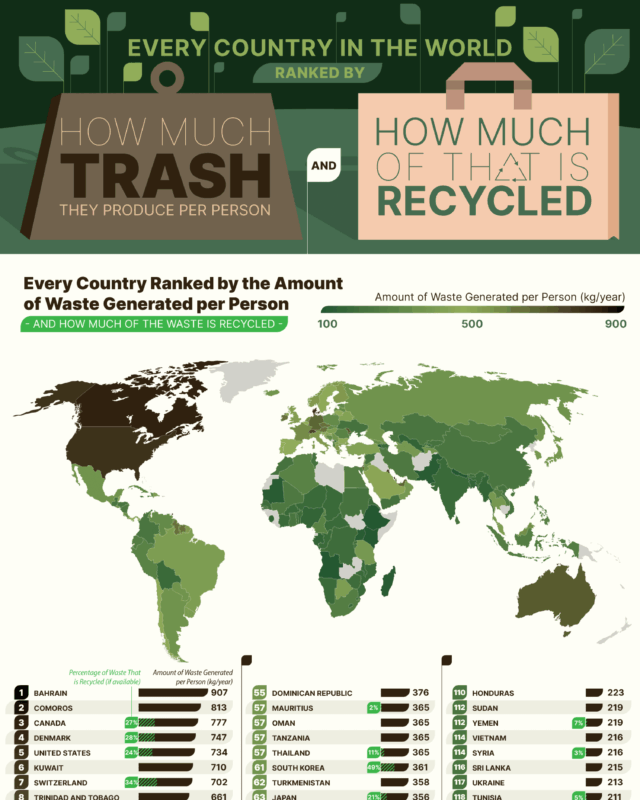
Singapore is a close second and recycles the highest share, 59%.

It groups 40 animals, including humans, into four bands of 5 hours.

The map shades every country by its own record and labels the hottest reading on each continent, from 55C in Tunisia to 20.7C in Antarctica.

The Woolworth Building leads in 1920 at 792 feet, the Empire State Building at 1,250 feet dominates from 1940, and One World Trade Center reaches 1,776 feet…

Dishwashers and microwaves last about 9 years and refrigerators 13, while kitchen cabinets reach 50 years and wood or stone floors 100.

Medians range from $35,308 for workers aged 16 to 19 to $98,488 for those with an advanced degree.

Walmart leads at $648 billion, followed by Amazon and China's State Grid.

General Electric fell from 1st to 68th, Intel to 206th, and only Microsoft moved up, to 3rd at $3.17 trillion.

Taylor Swift's Eras Tour leads at $2.08 billion from 149 shows, followed by Coldplay's Music of the Spheres Tour at $1.15 billion and U2's 360° Tour at…

This chart of racial diversity in America shows the White, Black, Asian, Hispanic and other or mixed shares of the 25 largest US metro areas, from Census…

Seven won the Super Bowl and six lost it, while four, including the 2024 Lions and 2019 Ravens, failed to win a playoff game.

The US took 42% of China's exports at the 1999 peak but only 13% in 2023.

Most were rare until the late 20th century, rose sharply, and are lower in 2024 than at their peak.
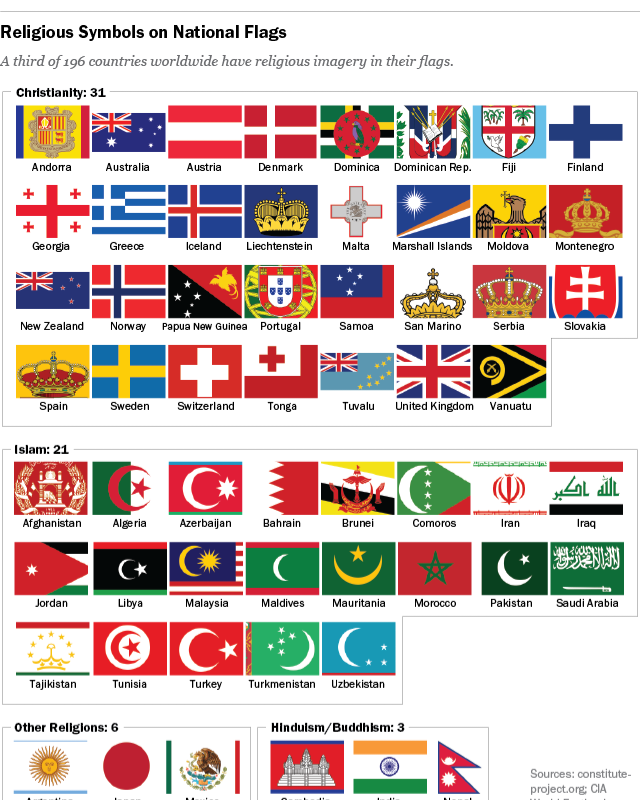
This chart groups them by religion: 31 with Christian symbols, 21 Islamic, six linked to other religions, three Hindu and Buddhist, two Buddhist and one…
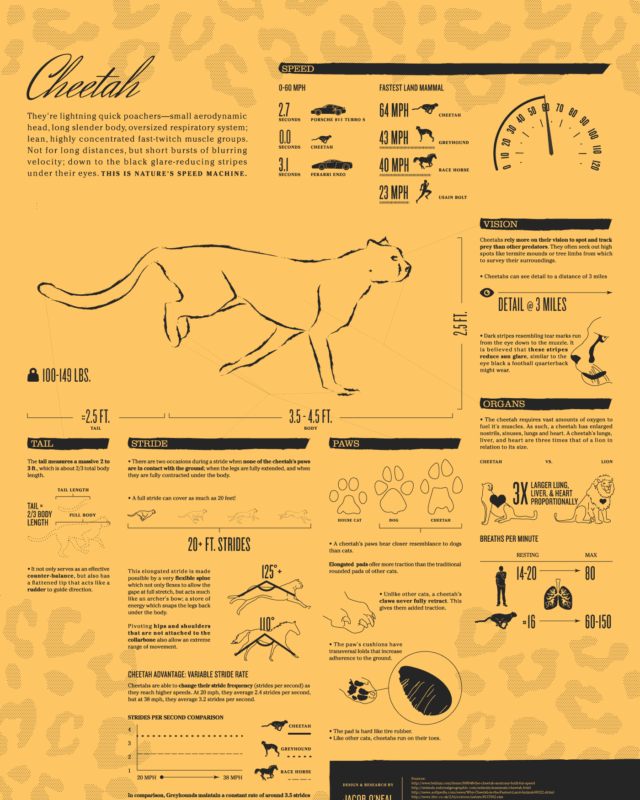
It gives a top speed of 64 mph and 0 to 60 mph in 3.0 seconds, and shows how the spine, stride, oversized organs, tail and paws make that possible.
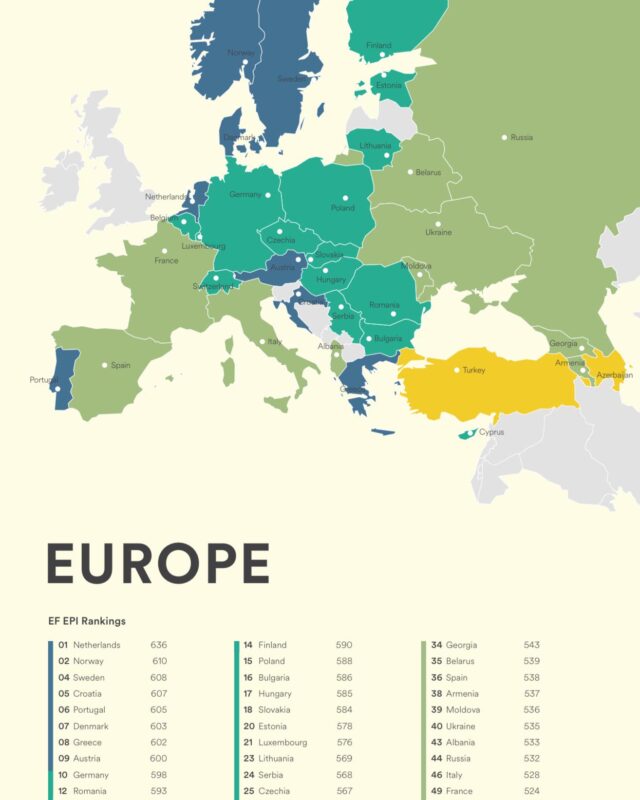
The Netherlands leads with 636, followed by Norway and Sweden, while Turkey and Azerbaijan are the only countries rated low.
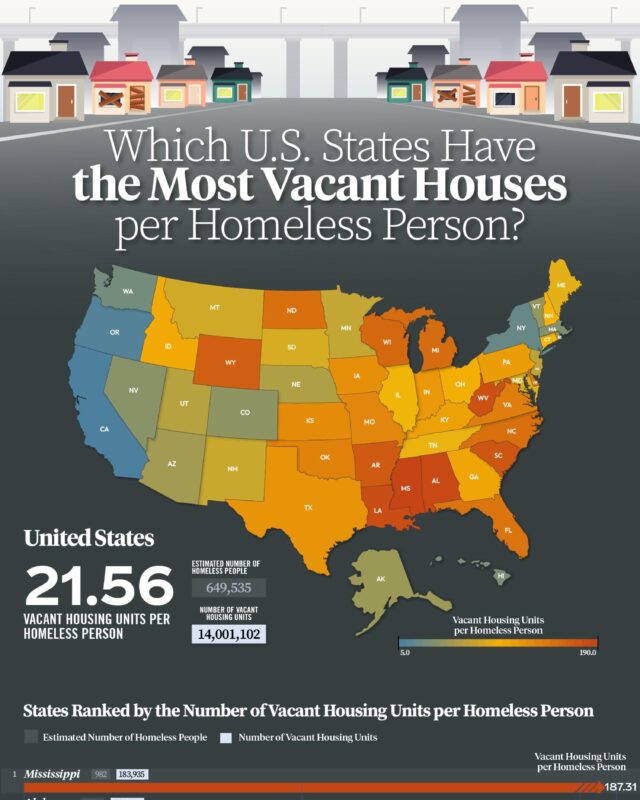
Nationally there are 21.56 vacant housing units per homeless person.

Training compute doubled about every 21 months until 2010 and about every 6 months since, rising from Theseus in 1950 to GPT-4 and Gemini 1.0 Ultra in 2023.
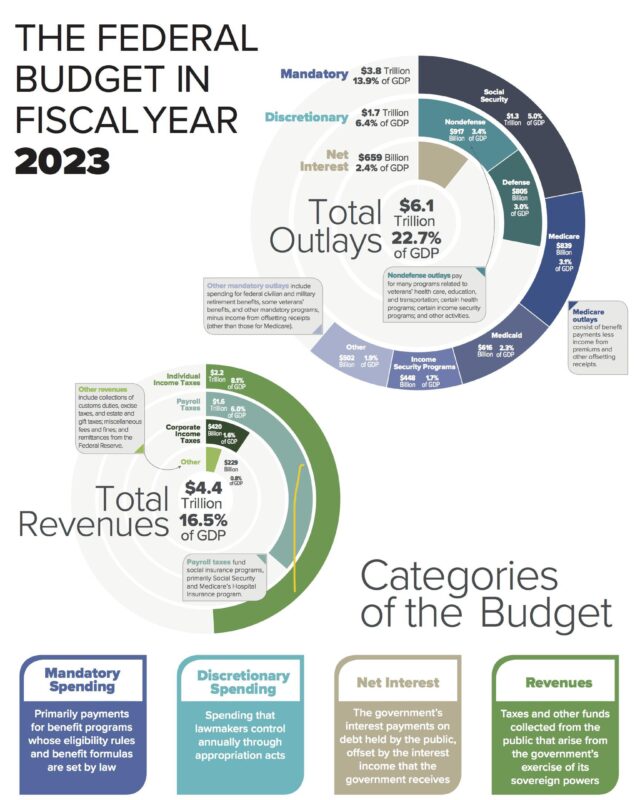
In fiscal year 2023 the US government spent $6.1 trillion and collected $4.4 trillion, a deficit of $1.7 trillion or 6.3% of GDP.

Infections and birth problems such as malaria, diarrhoea and preterm birth fill much of the treemap, alongside heart disease, stroke, cancers and injuries,…

The United States holds $11.8 trillion, close to half, followed by Japan with $2.1 trillion and Canada with $1.8 trillion.

Hawaii is highest at about $259,000, followed by Massachusetts and California, while West Virginia is lowest at about $82,000.

Franklin Roosevelt in 1936 scores highest, and Richard Nixon in 1968 is the only winner below zero.
Every topic page starts with a short guide to the subject.








Give it a permanent page where people looking for your subject find it, with your name and a link to your site. Content marketers, agencies, designers and researchers all list here.