

Technology
Largest Semiconductor Companies by Market Cap, December 2024
NVIDIA led at $3.4 trillion, followed by Broadcom at $1.1 trillion and TSMC at $1.0 trillion, then ASML and Samsung.
471 reviewed infographics. Search them, or narrow the list by topic and sort it the way you want.
NVIDIA led at $3.4 trillion, followed by Broadcom at $1.1 trillion and TSMC at $1.0 trillion, then ASML and Samsung.

Short kicks were always near certain, at 97% to 99%.

Louisiana is the most dependent at 42%, followed by Kentucky at 40% and Michigan at 35%, against 18% for the U.S. as a whole.
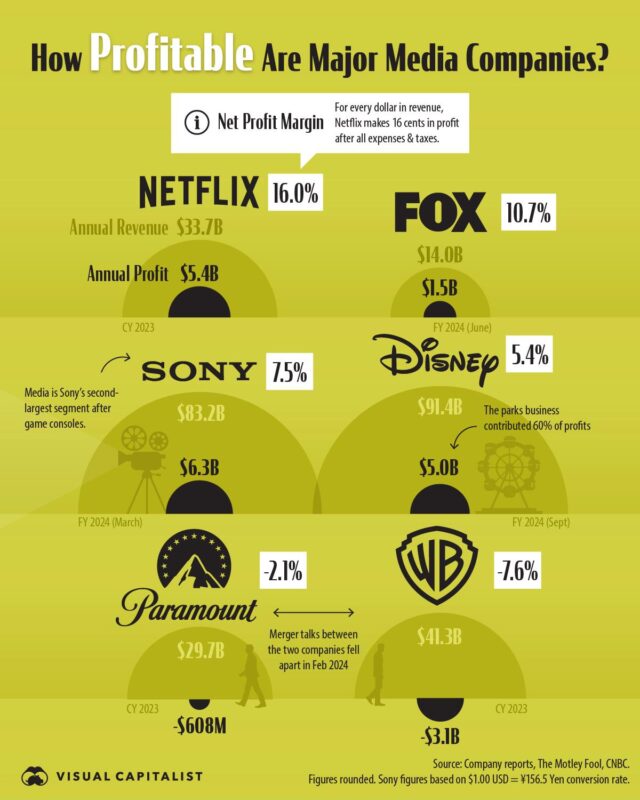
Netflix leads at 16.0%, making 16 cents of profit per dollar of revenue, ahead of Fox, Sony and Disney.

Mexico works longest, about 41 hours a week for one of the lowest wages, while Germany, Norway and Denmark work about 26 to 27 hours for more than $1,000.

Penicillin, found in 1928, took 15 years to reach patients, while several classes from the 1950s were in use within a year.

You apply for ETIAS before travelling, the EES records you at entry and exit, and the 90/180 rule limits your stay to 90 days in any 180.
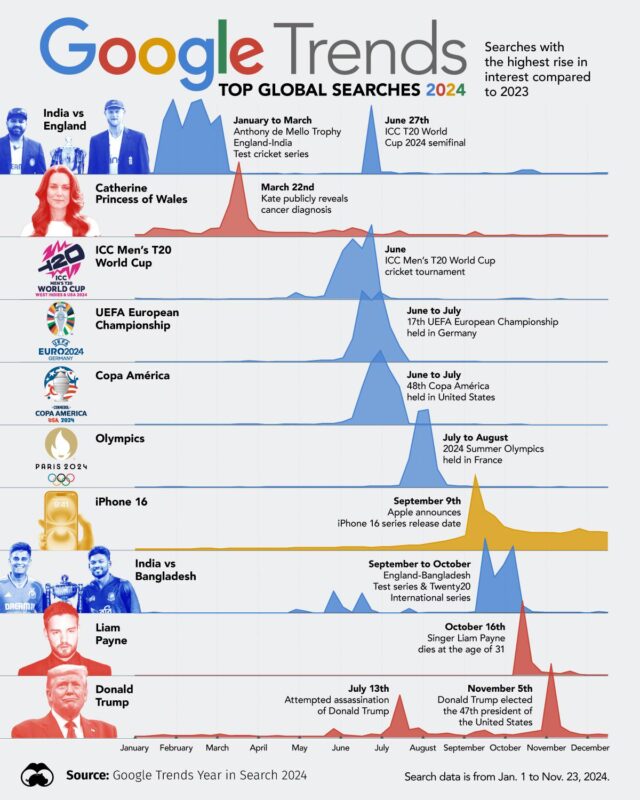
Six are sports events, led by Copa América, the UEFA European Championship and the ICC Men's T20 World Cup.
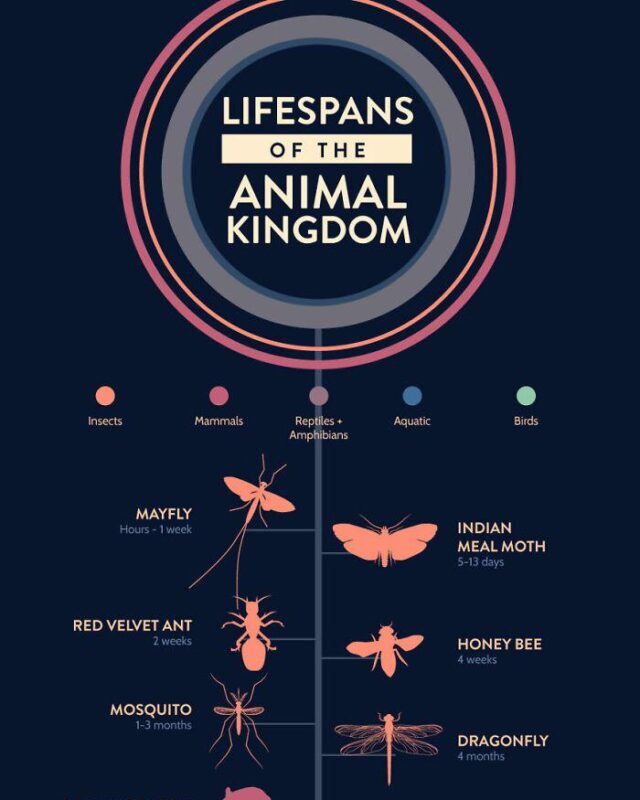
Most familiar mammals live between about 2 and 50 years, a dog about 13 and a cat about 15.

The Great Language Race is a family tree of the world's languages by Kolya Fabrika, drawn as a race from 5000 BC to today.
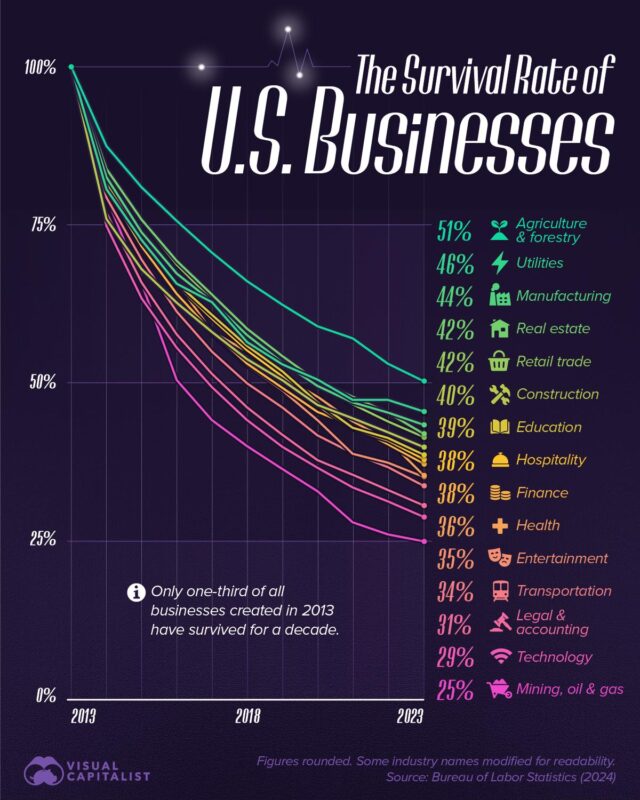
Of the private-sector business establishments that opened in the year to March 2016, 34.2% were still operating in March 2026.

The World Bank puts the share at 9.8% in 2026, or about 811 million people, down from 43% in 1990.

Nepal has the most, with 31 national public holidays in 2018, followed by Cambodia (30), Sri Lanka (28) and Iran (26).
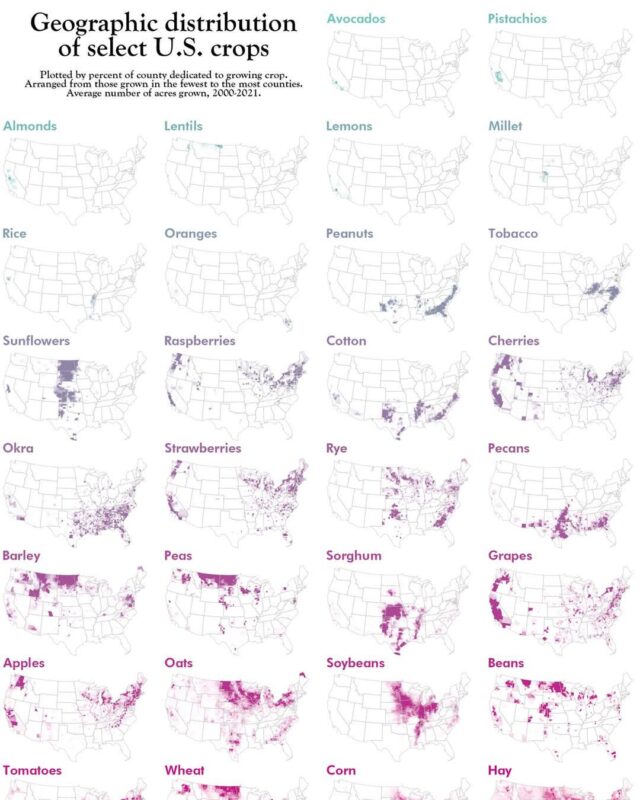
In 2025 corn covered 91.3 million harvested acres, more than any other crop.
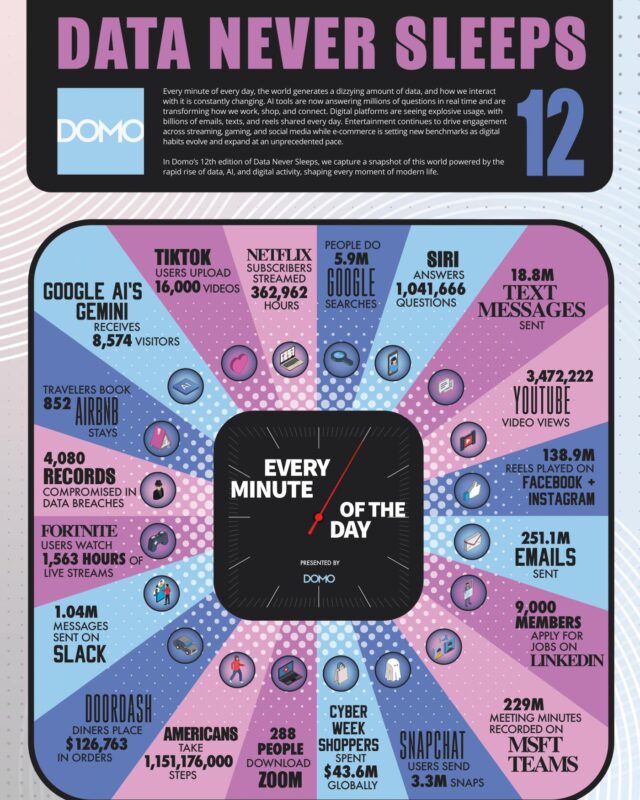
That is roughly 407 exabytes a day.

On Eurostat's 2025 figures, 93.8% of people in Slovakia live in a home their household owns, followed by Romania at 93.2% and Croatia at 91.4%.

Gordon Moore, who went on to co-found Intel, first predicted a doubling every year in 1965 and changed it to every two years in 1975.
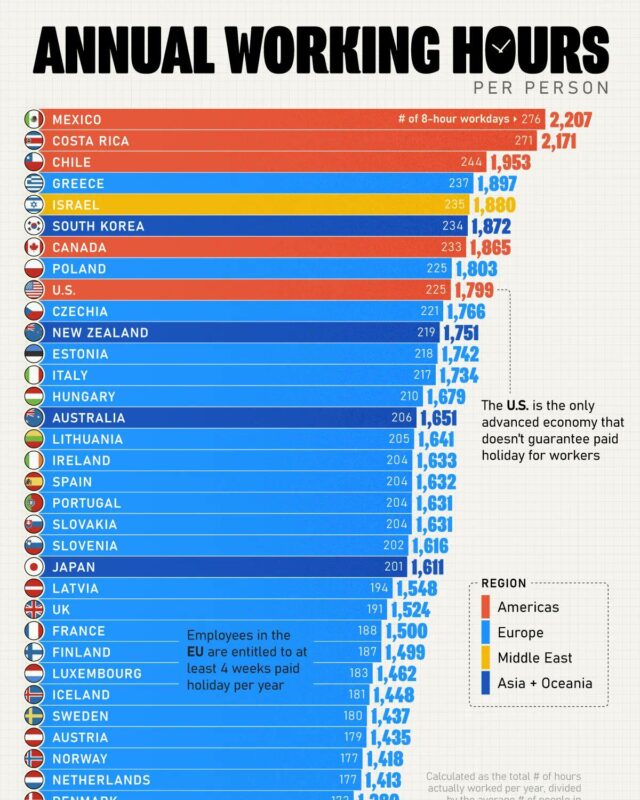
On the latest OECD figures, for 2025, people in work in Mexico put in 2,205 hours a year, the most of any OECD country, followed by Costa Rica at 2,183 and…

Michigan was close behind at 25%, followed by Tennessee and Illinois at 20% each.
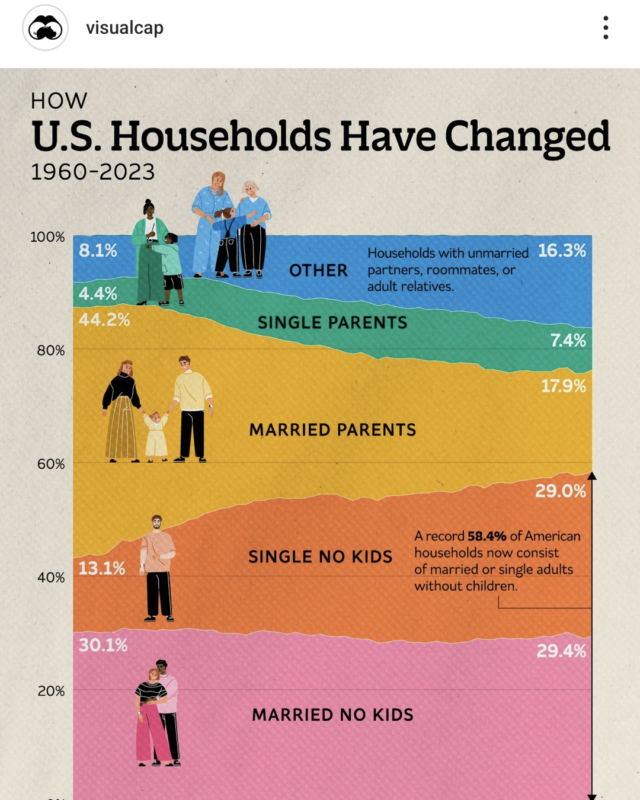
In 1960 married couples with children made up 44.2% of households.

Streaming apps such as Netflix and Disney+ took the most, $8.2 billion, followed by dating apps at $5.7 billion and short video apps such as TikTok at $4.3…

About 15.8 million people gave money at least once, 24% of the population.

The United States is second at 5.0 billion tonnes and India third at 3.2 billion.

Yemen came last of 163 countries, the United States ranked 132nd and the UK 34th, and average global peacefulness fell for the 12th time in 16 years.
Every topic page starts with a short guide to the subject.








Give it a permanent page where people looking for your subject find it, with your name and a link to your site. Content marketers, agencies, designers and researchers all list here.