

Health and Fitness
Antidepressant Side Effects Chart for 14 Common Medicines
This antidepressant side effects chart from WhatMedicine.Org scores 14 antidepressants from 0 (none) to 4 (high) on sexual dysfunction, stomach upset,…
471 reviewed infographics. Search them, or narrow the list by topic and sort it the way you want.
This antidepressant side effects chart from WhatMedicine.Org scores 14 antidepressants from 0 (none) to 4 (high) on sexual dysfunction, stomach upset,…
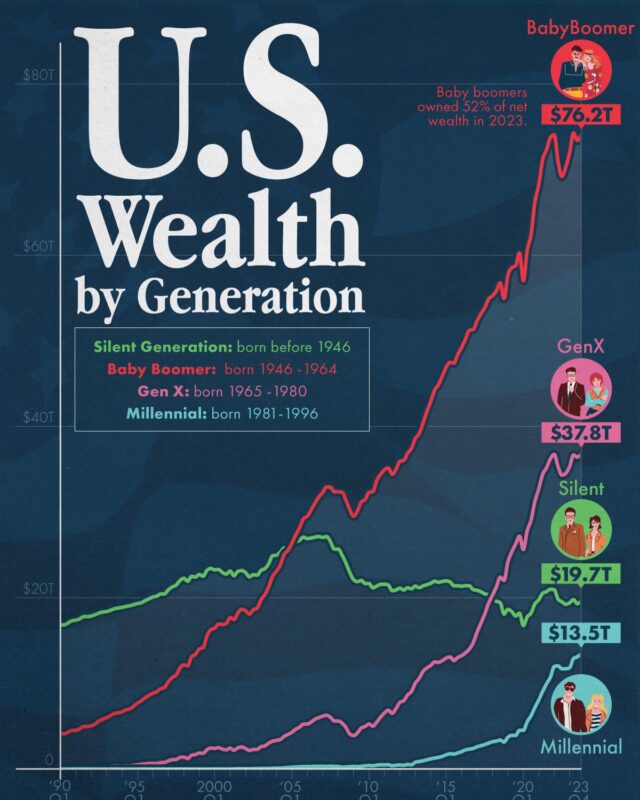
At the end of 2023 Baby Boomers held $76.2 trillion, 52% of the country's net wealth, ahead of Gen X at $37.8 trillion, the Silent Generation at $19.7…
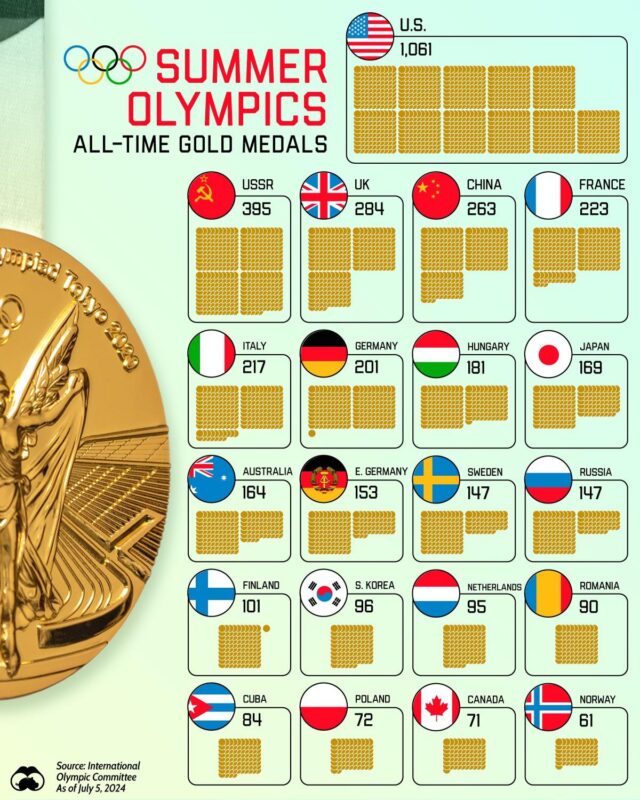
The US leads with 1,061 golds, far ahead of the Soviet Union (395), the UK (284) and China (263).
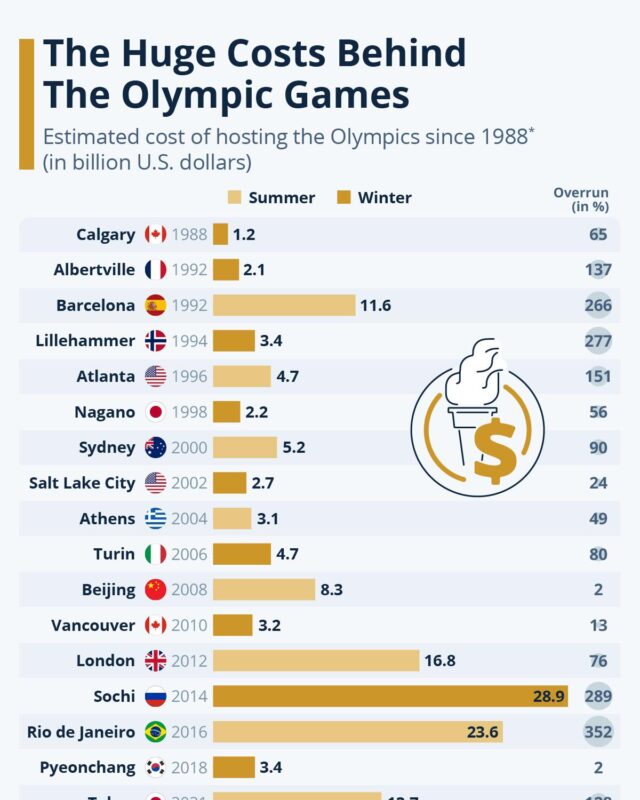
Sochi 2014 cost the most at US$28.9 billion, Rio 2016 overran by 352%, and Paris 2024 cost US$8.7 billion.

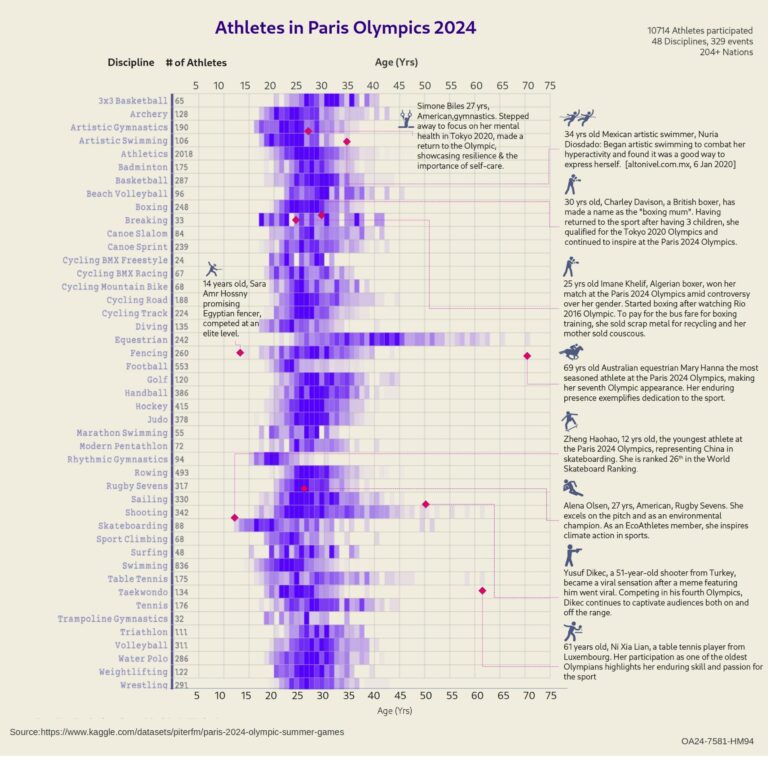
Equestrian had the oldest, with a rider of about 70 on the chart (69 according to her article), while skateboarding had the youngest, about 12, and also a…

Poland shows the widest gap the other way, with 2% for Russia and 86% for the USA.

Not voting was the most common result in 11 of the 12 elections, peaking at 48% in 1996.

Kuala Lumpur at RM3,927 to Kelantan at RM1,600, plus Singapore and Brunei.

This hand drawn mind map sets out computer science basics in six branches: computers, problem solving, programming, data, communication and the bigger picture.

This Sainsbury's Bank infographic covers basic vehicle maintenance for UK drivers: nine checks before you drive, from battery and oil to tyre tread of at…

This chart from the Motorcycle Legal Foundation shows 16 motorcycle hand signals used on group rides, from turning and stopping to single file, refreshment…

Lionel Messi holds four of the top five player seasons, led by 5.83 in 2018/19, and Manchester City has eight of the top 20.

This chart of service industry operating margins in Mexico, made by the Margin newsletter with tukan data, compares each sector's margin in 2018 with an…

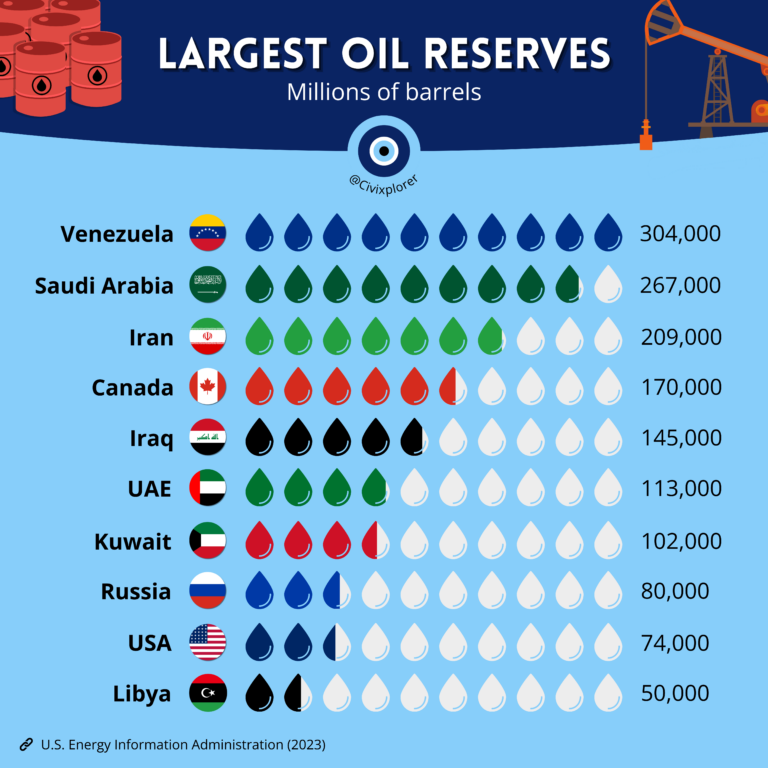
The world produced 82,757 thousand barrels per day.

Antimatter tops it at $62.5 trillion a gram, followed by rare isotopes, lab-made molecules and gemstones such as painite and red beryl.

Bard College at Simon's Rock in Massachusetts is highest at $63,583 a year and the University of Wyoming is the lowest state maximum at $20,827.

Only the pyramid still stands, and all seven existed together for less than 60 years.

Crude petroleum (5.8%), aircraft parts (5.61%) and refined petroleum (5.59%) are the largest products, and Canada (17.5%), Mexico (16%) and China (7.32%)…

Cows and roses lead with 12 nicknames each, followed by apples with 9.

France collects the most tax relative to its economy, 46% of GDP, followed by Italy and Germany.

Montana Highway 200 is the longest of all at 706.5 miles, and District of Columbia Route 295 the shortest of them at 4.3 miles.

Nationally a year of income covers 20% of a home, about five years of income.

Paris 2024 runs far ahead of the rest, passing 55 medals by day 13 on the way to a final 64, while the earlier Games ended between 29 and 43 medals.
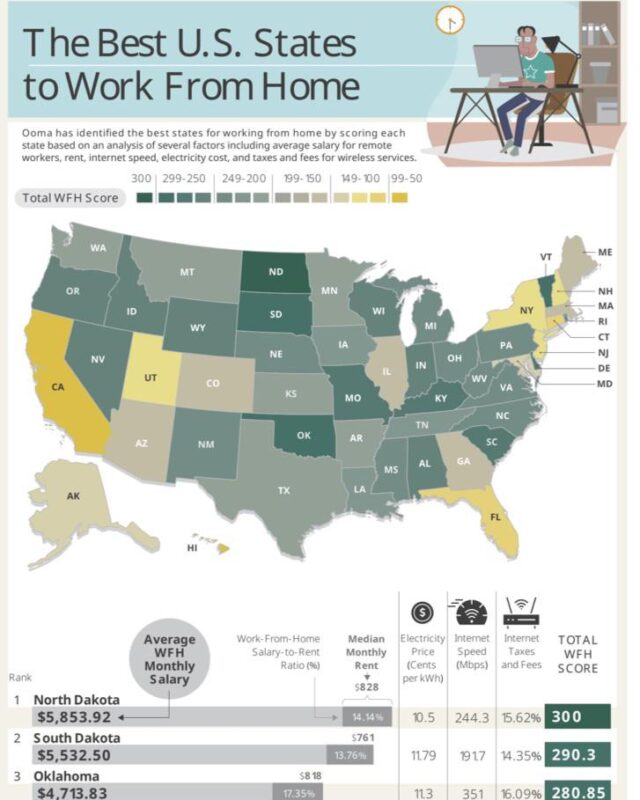
North Dakota comes first with 300 points, followed by South Dakota and Oklahoma, while Florida, Hawaii and California sit at the bottom.
Every topic page starts with a short guide to the subject.






Give it a permanent page where people looking for your subject find it, with your name and a link to your site. Content marketers, agencies, designers and researchers all list here.