

Finance and Economy
China Export Ranking 2023 for Smartphones, Top Destinations
The United States took 28% and Hong Kong 22.8%, together just over half.
476 reviewed infographics. Search them, or narrow the list by topic and sort it the way you want.
The United States took 28% and Hong Kong 22.8%, together just over half.

Germany was the largest net contributor at 25,572 million and Poland the largest net beneficiary at 11,910 million.

Los Angeles City and County had the most people experiencing homelessness, 65,111, followed by New York City with 61,840 and Seattle/King County with 13,368.

Richer countries use more electricity (R² 0.8), and the high income, low electricity corner is empty.

Indian-Americans lead at $100,500, followed by Filipino-Americans and Taiwanese-Americans, against $56,200 for the average American and $35,000 for…

The ratio peaked around 2008, hit its low in April 2020 with gold at $1683 an ounce and oil at $21 a barrel, and stood 30% below its 1960s level in 2024.

In 2023 services made up 25% of world exports.
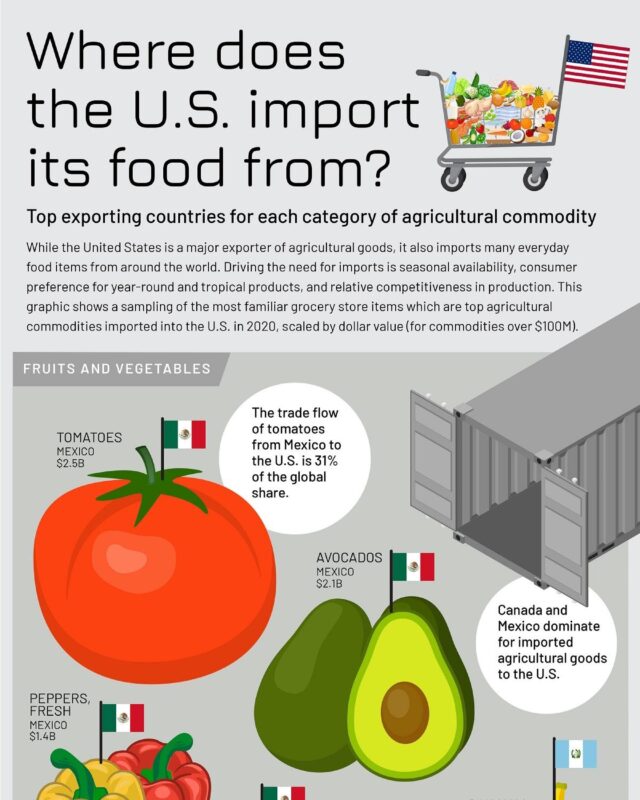
Mexico leads for most fruit and vegetables, with tomatoes worth $2.5 billion, while frozen shrimp from India is the largest single item at $1.9 billion.

Total exports grew from $339 billion to $3.41 trillion.

World output more than tripled to about 1,864 million tonnes in 2020, with China rising from 14 to 1,053 million tonnes while US output fell.

India leads at 6.3% a year, ahead of the UAE and Indonesia at 5.5%.
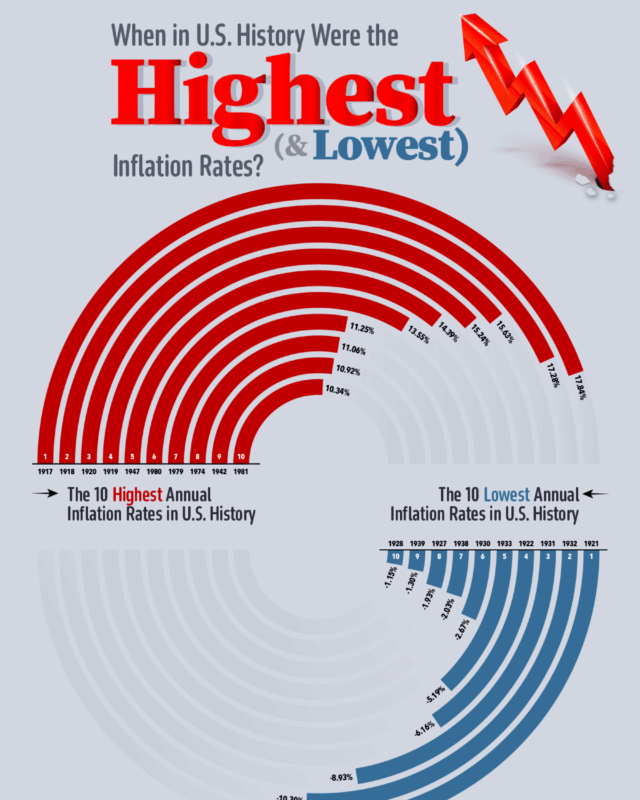
The highest annual rate was 17.84% in 1917 and the lowest minus 10.94% in 1921, when prices fell.

It shows which countries make each part of a Boeing 787 Dreamliner, and who earns the money from a banana and an iPhone.
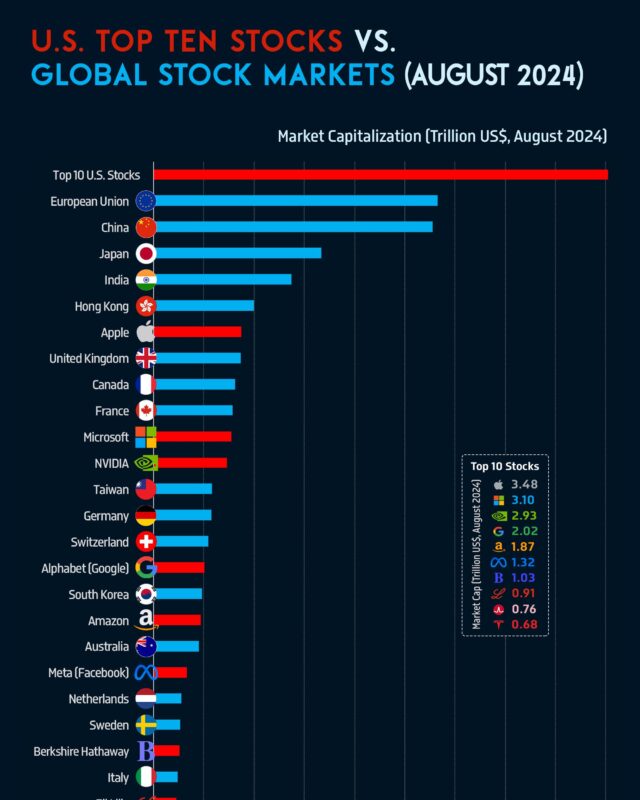
Together Apple, Microsoft, NVIDIA and seven others were worth $18.10 trillion, more than the whole stock market of the European Union or China.

World output reached an estimated 3,100 tonnes in 2022, led by China at 330 tonnes and Russia and Australia at 320 each.
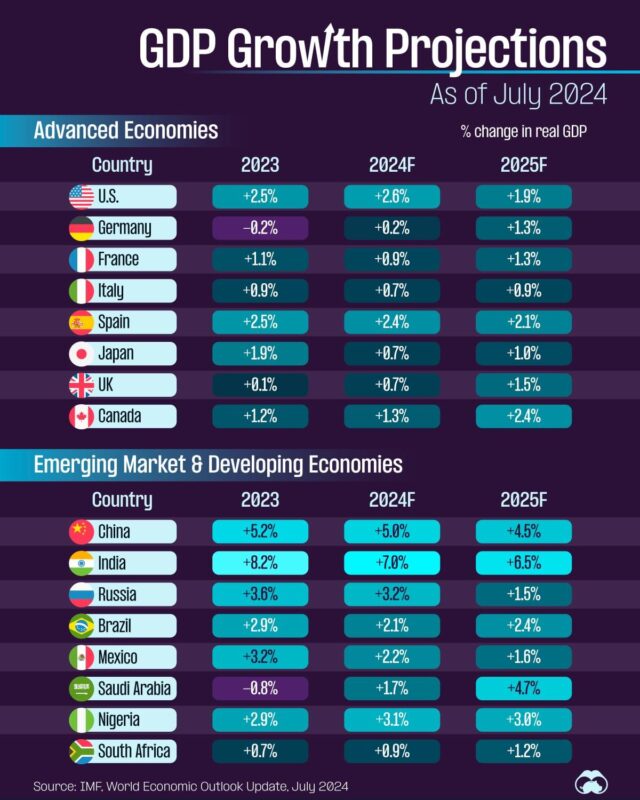
India leads every year at 8.2%, 7.0% and 6.5%, while Germany and Saudi Arabia shrank in 2023.

Equities and mutual funds rose from 10% to 28% of household wealth and 401k plans from 5% to 9%, while real estate fell from 34% to 30%, pensions from 17%…

California ($2.97 trillion) matches the UK, Texas ($1.78 trillion) matches Canada and New York ($1.7 trillion) matches South Korea, using 2018 figures from…

The US median was about $440,000.

Telephones, computers and integrated circuits lead the products, and the United States takes 14.6% of exports, ahead of Hong Kong at 8.16%.

New York leads with 101 billionaires and Michael Bloomberg at $94.5 billion, ahead of Hong Kong, Beijing, Shanghai, London, Moscow, Mumbai and Shenzhen.

This CoffeeSpace timeline runs from Reddit's 2005 founding to the Reddit IPO 2024 listing on the New York Stock Exchange.
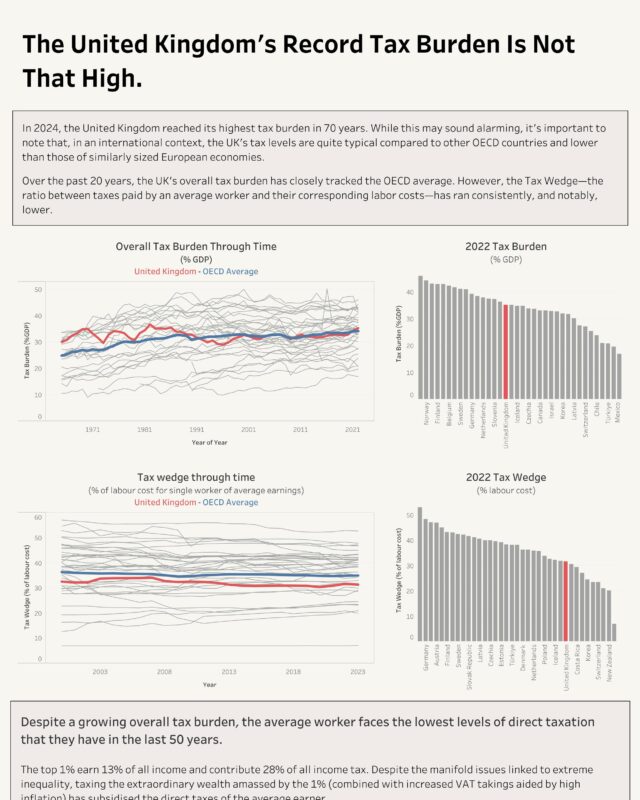
Its tax burden hit a 70 year high in 2024, yet at about 35% of GDP it sits near the OECD average and 16th of 36 countries in 2022.

West Virginia, New Mexico, Kentucky, Arkansas and Alabama are also above 15%.
Every topic page starts with a short guide to the subject.








Give it a permanent page where people looking for your subject find it, with your name and a link to your site. Content marketers, agencies, designers and researchers all list here.