

Business
Largest Companies by Market Cap in 1997 and in 2025
General Electric fell from 1st to 68th, Intel to 206th, and only Microsoft moved up, to 3rd at $3.17 trillion.
476 reviewed infographics. Search them, or narrow the list by topic and sort it the way you want.
General Electric fell from 1st to 68th, Intel to 206th, and only Microsoft moved up, to 3rd at $3.17 trillion.

The US took 42% of China's exports at the 1999 peak but only 13% in 2023.
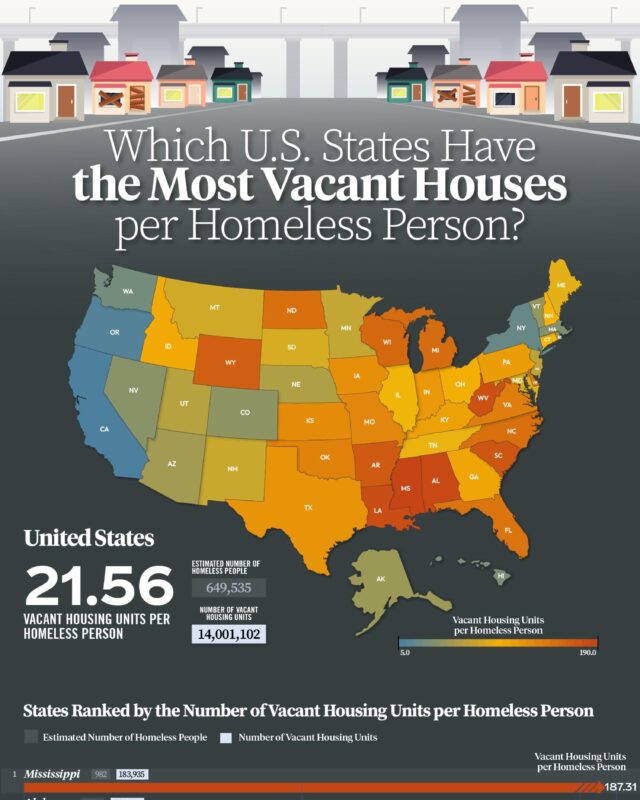
Nationally there are 21.56 vacant housing units per homeless person.
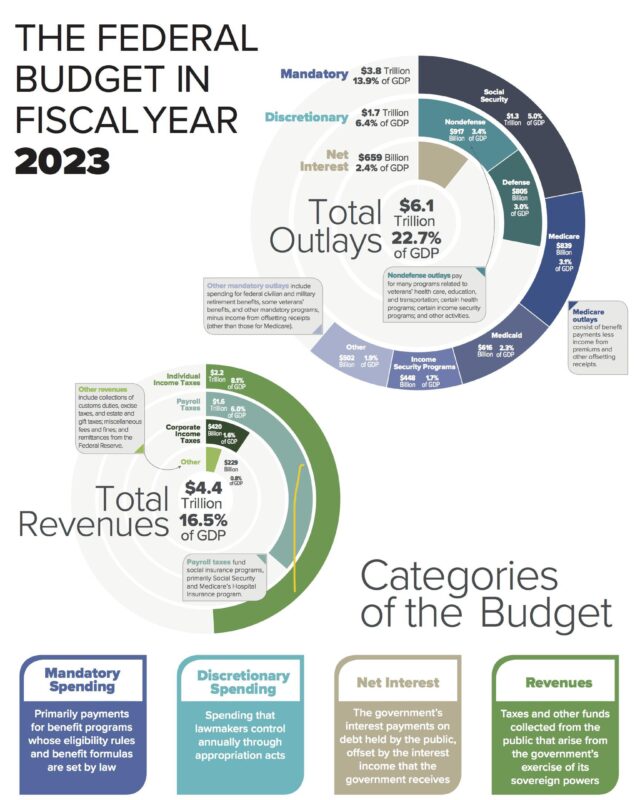
In fiscal year 2023 the US government spent $6.1 trillion and collected $4.4 trillion, a deficit of $1.7 trillion or 6.3% of GDP.

The United States holds $11.8 trillion, close to half, followed by Japan with $2.1 trillion and Canada with $1.8 trillion.

Hawaii is highest at about $259,000, followed by Massachusetts and California, while West Virginia is lowest at about $82,000.

JPMorgan Chase finishes far ahead, while Citi falls from first in the early 2000s to last.

China exported $3.4 trillion of goods in 2023, ahead of the European Union at $2.8 trillion and the United States at $2.0 trillion, after growing about 12%…
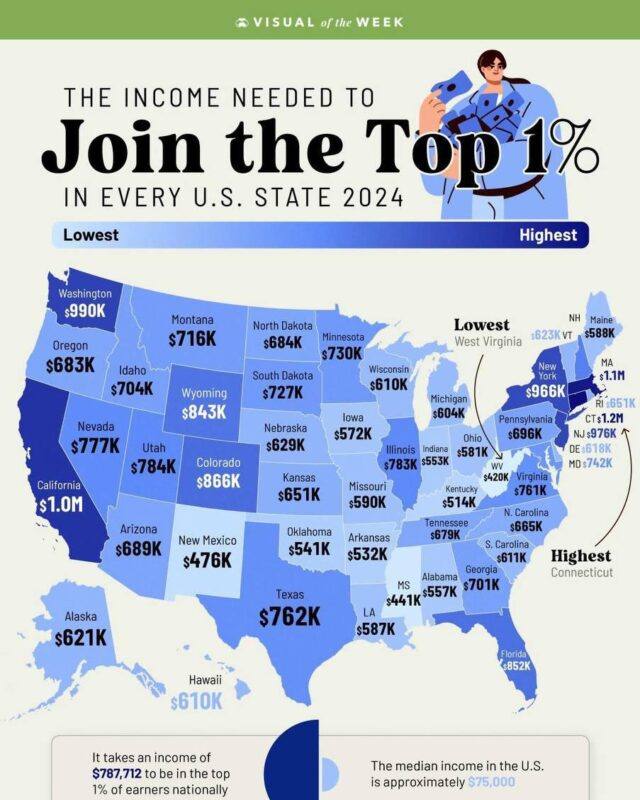
Nationally it takes $787,712 to join the top 1% of earners.

In the 12 months to November 2024 the US ran a $879 billion total deficit: a $1,171 billion shortfall on goods, partly offset by a $292 billion surplus on…

Asia grew from $96 billion to $18,793 billion and overtook Europe in 2010, lifting its share of global trade from 15% to 39% while Europe fell from 51% to 35%.

Their combined market value rose from $1.1 trillion in 2012 to $17.6 trillion at the end of 2024, a 26% annual rate.

Exports to the top three alone supported more than 4 million US jobs.

Fuels and related products led in 2023 at $247 billion, followed by precious metals and stones at $127 billion and other minerals and metals at $107 billion.

NVIDIA led at $3.4 trillion, followed by Broadcom at $1.1 trillion and TSMC at $1.0 trillion, then ASML and Samsung.

Louisiana is the most dependent at 42%, followed by Kentucky at 40% and Michigan at 35%, against 18% for the U.S. as a whole.

Mexico works longest, about 41 hours a week for one of the lowest wages, while Germany, Norway and Denmark work about 26 to 27 hours for more than $1,000.

Nepal drops from above 60% to close to zero, while India ends highest of the five at roughly 13%.

Romania tops the list at 95.6%, most eastern members are above 80%, and Germany is lowest at 47.6% despite a high income.

Kentucky is highest at 26%, ahead of Michigan at 25% and Tennessee and Illinois at 20%, against a national figure of 11%.

December stands out at 1,049 million euros, about 18% of the year, against 327 million in June.

The United States ($30.3 trillion) and China ($19.5 trillion) make up about 43% of the total, followed by Germany, Japan and India, while all of Africa…

Brazil was second at US$143 billion and the Netherlands third at US$118 billion.

It puts the 2023 US goods deficit at $1.15 trillion, against an EU surplus of $40 billion and China's surplus of $823 billion, and marks events from NAFTA…
Every topic page starts with a short guide to the subject.









Give it a permanent page where people looking for your subject find it, with your name and a link to your site. Content marketers, agencies, designers and researchers all list here.