

Finance and Economy
Turkey GDP Per Capita by Province, 2004 to 2023
In 2023 Kocaeli led with $21,985, just ahead of İstanbul at $21,741, while Şanlıurfa had $4,971.
476 reviewed infographics. Search them, or narrow the list by topic and sort it the way you want.
In 2023 Kocaeli led with $21,985, just ahead of İstanbul at $21,741, while Şanlıurfa had $4,971.

In the 12 months to the third quarter of 2024, machinery and transport equipment led at $149.2 billion, followed by other manufactured goods at $113.6…

In the 12 months to September 2024, mineral fuels led at $133.7 billion, ahead of other manufactured goods and machinery and transport equipment at about…

In the 12 months to September 2024, the US exported US$333 billion of goods to Mexico and imported US$498 billion, a US$165 billion deficit.
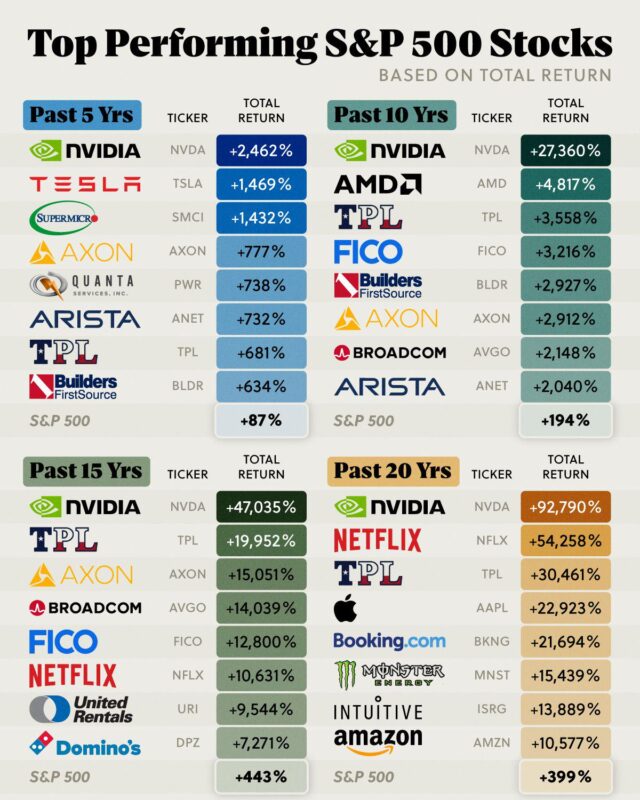
NVIDIA leads every period, up 92,790% over 20 years against 399% for the S&P 500.

World pharmaceutical exports passed $900 billion that year.

This Econovis chart sets the US manufactured goods trade deficit of $1.22 trillion in 2023 against China's $1.81 trillion surplus and the EU's $0.44…

Sales boomed to a peak of 74,300 in 2022, then fell back to about 23,800.
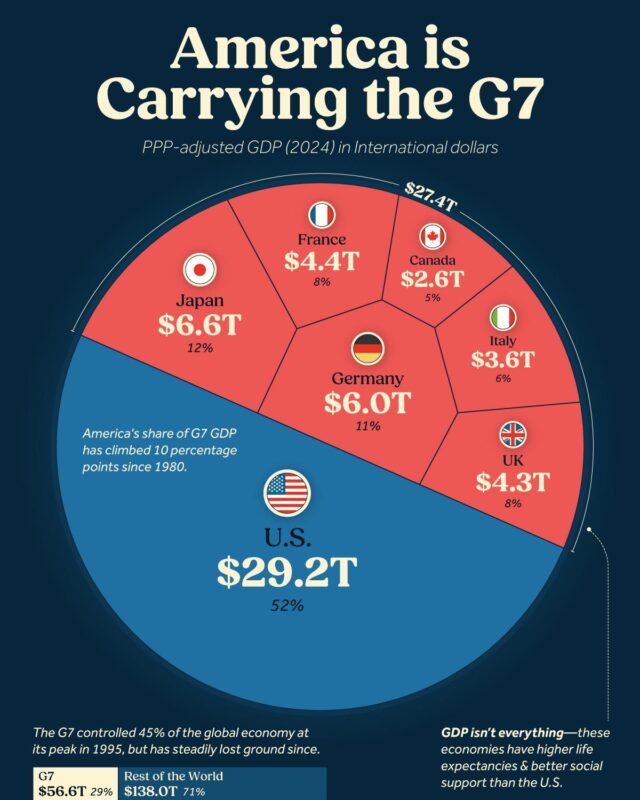
The United States accounts for $29.2 trillion, 52% of the group's $56.6 trillion, more than Japan, Germany, France, the UK, Italy and Canada combined.

Pharmaceuticals grew from €6.9 billion to €112.6 billion and, with machinery (€90.4 billion) and vehicles (€77.2 billion), now make up about half of EU…

Bitcoin accounted for $1,980 billion, about 54%, followed by other coins at $1,020 billion, Ethereum at $481 billion and stablecoins at $194 billion.
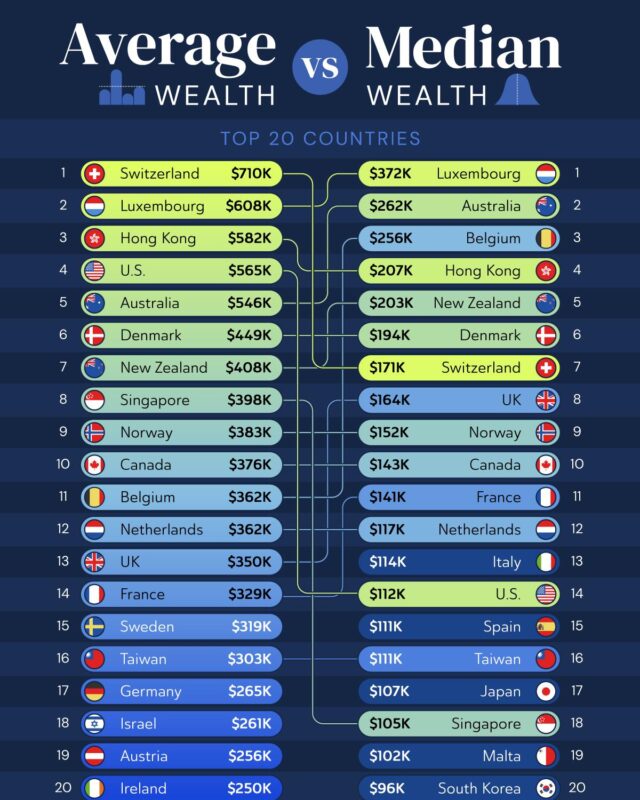
Luxembourg leads on median wealth at $372,000 per adult, while Switzerland leads on average wealth at $710,000.

It grew from about $97 billion in 1992 to a peak of about $1.2 trillion in 2022, with sharp drops in 2001 and 2009.

Hawaii is least affordable at 9.1, followed by California at 8.4, while West Virginia is lowest at 2.9.

Median household income was $80,610, the most common band below $200,000 is $50,000 to $55,000, and 14.4% of households earn over $200,000.

M2 money supply from 1970 to November 2024, with both rebased so the 1960s average equals 100.

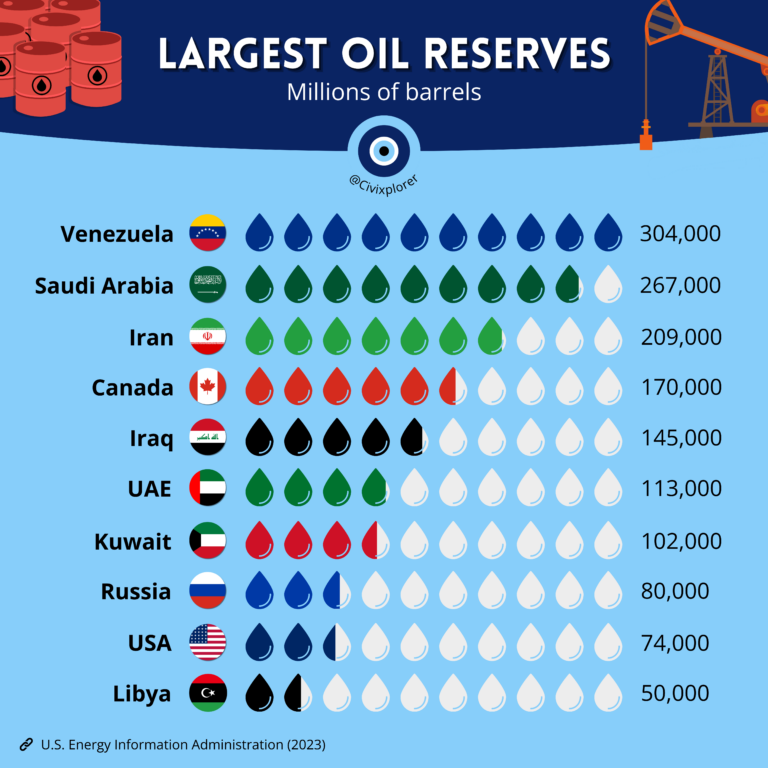
Energy Information Administration figures for 2023.

This currency etymology infographic by the Etymology Nerd explains how 16 currencies got their names.

All three rose to 2007, fell after the housing bubble burst and climbed sharply after 2020.
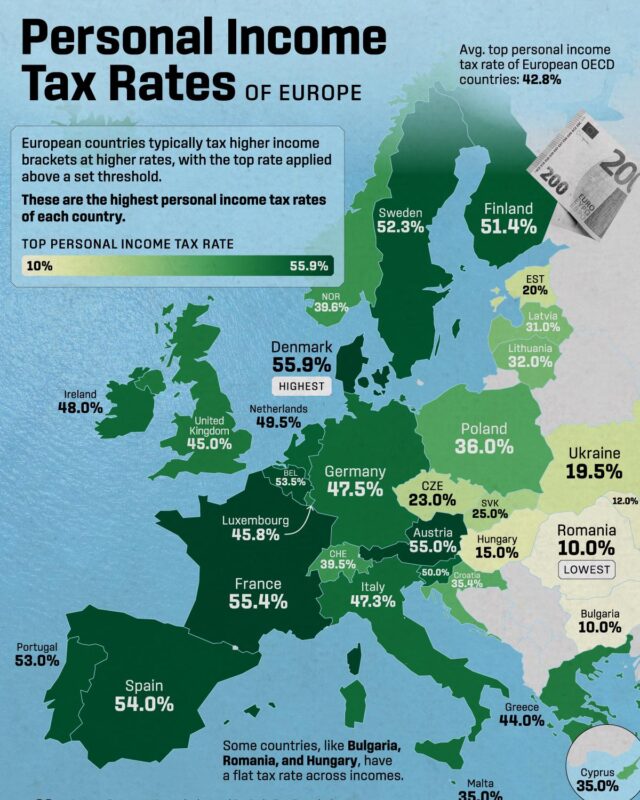
Denmark was highest at 55.9%, ahead of France and Austria, while Romania and Bulgaria were lowest at a flat 10%.
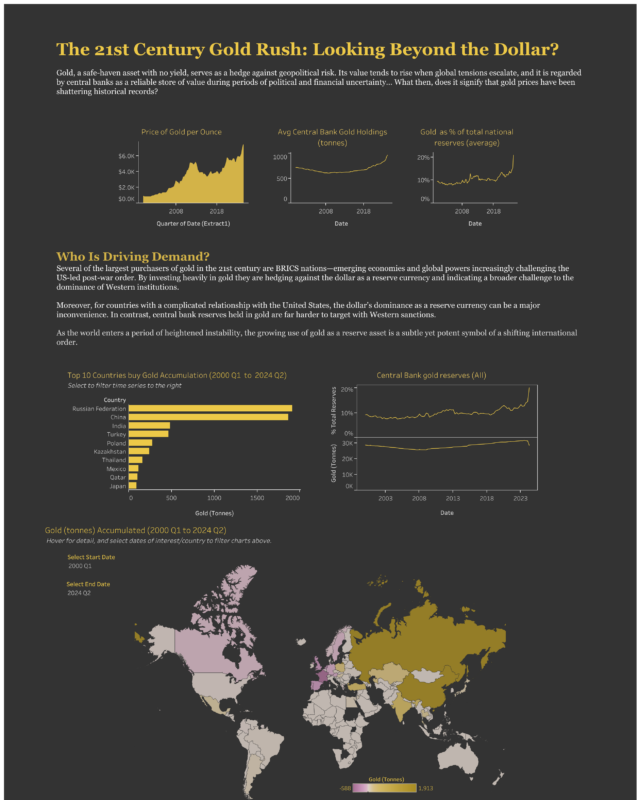
Russia and China lead its top 10 buyers, ahead of India, Turkey and Poland.
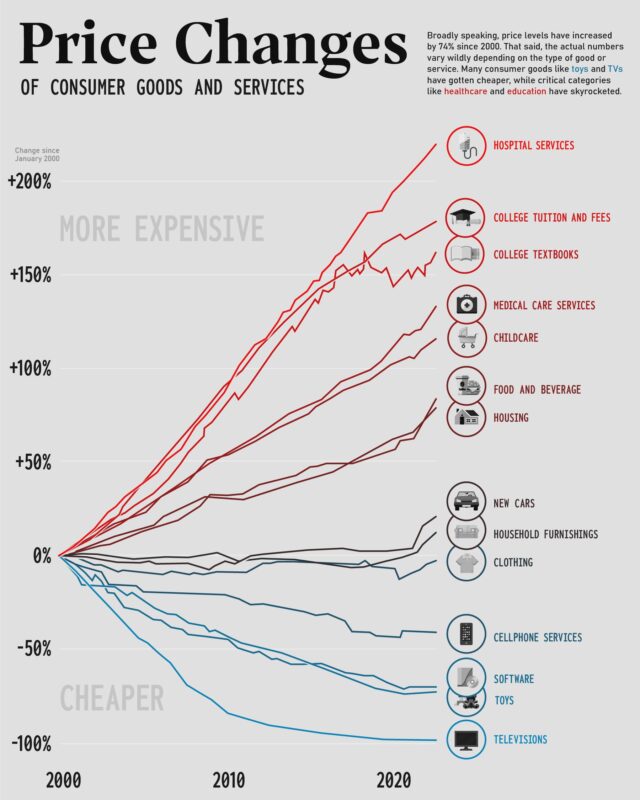
Hospital services, college tuition and childcare more than doubled, while toys, software and televisions got much cheaper, against overall inflation of…

Massachusetts is highest at $107K and Mississippi lowest at $55K.

It covers two working adults with two children on a 50/30/20 budget.
Every topic page starts with a short guide to the subject.










Give it a permanent page where people looking for your subject find it, with your name and a link to your site. Content marketers, agencies, designers and researchers all list here.