

Sports
NFL Point Differential for the 65 Teams That Started 10-1
The 2007 Patriots hold the season record at +315, and of the 65 teams to start a season 10-1, the 2024 Chiefs had the second lowest margin, +52.
471 reviewed infographics. Search them, or narrow the list by topic and sort it the way you want.
The 2007 Patriots hold the season record at +315, and of the 65 teams to start a season 10-1, the 2024 Chiefs had the second lowest margin, +52.

Most are built to avoid tools that look for malicious files, which is why 82% of the detections CrowdStrike saw in 2025 were malware-free.
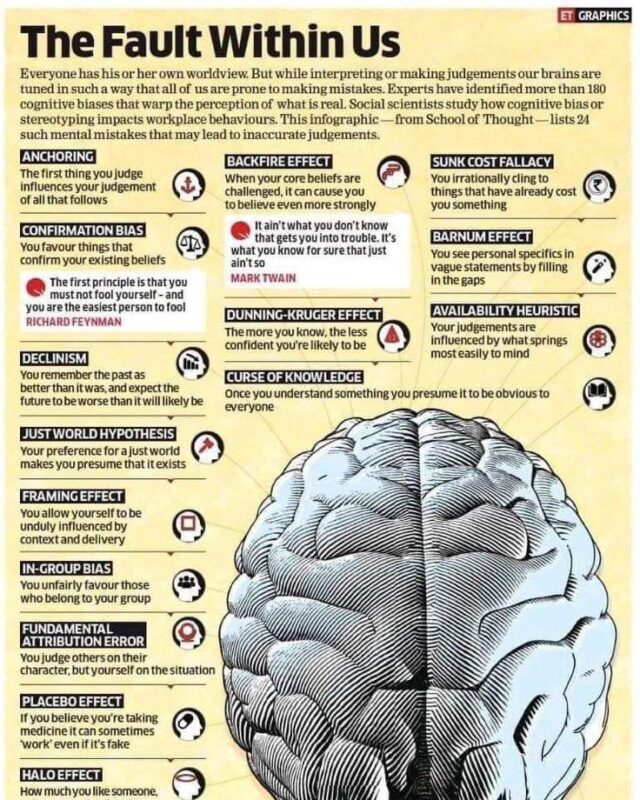
Researchers have named more than 180, but a couple of dozen do most of the damage in everyday decisions, from anchoring and confirmation bias to the sunk…
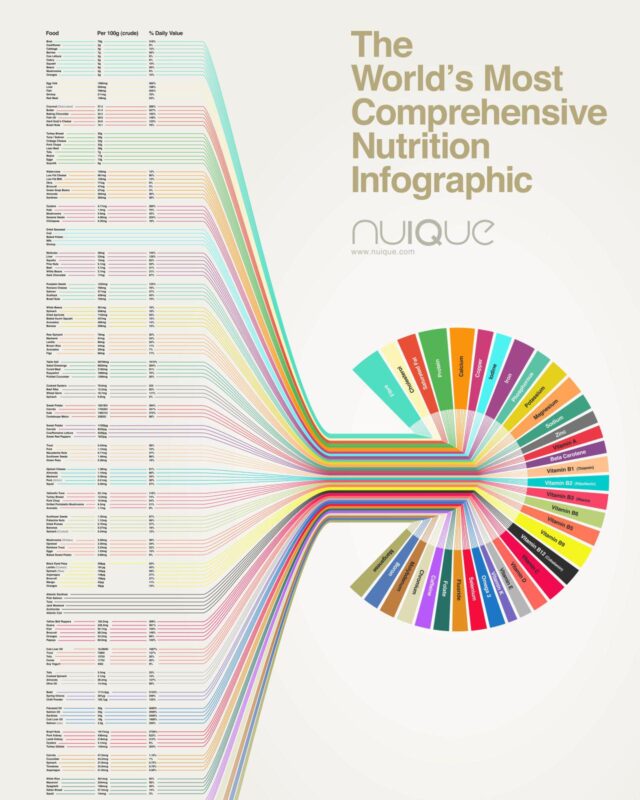
Below are the top food sources for 35 nutrients, checked against USDA data and current Daily Values.
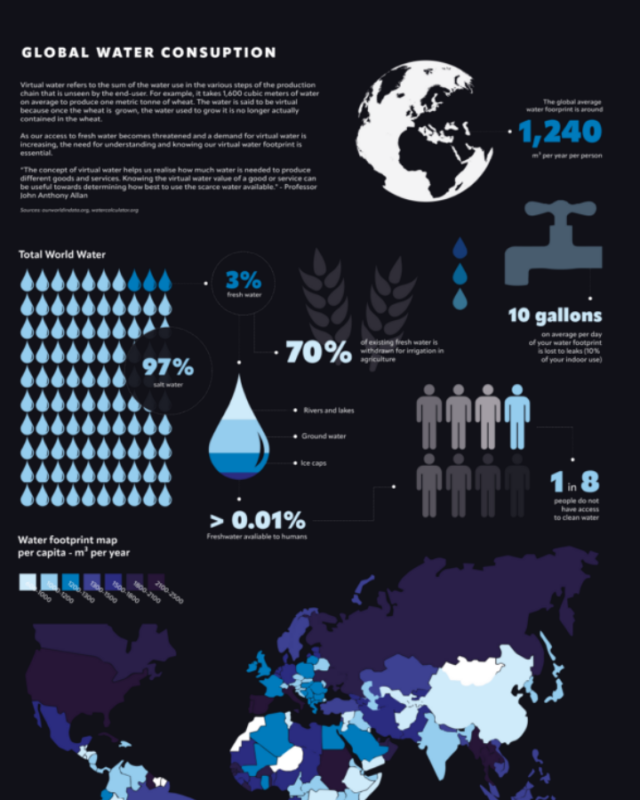
People withdraw about 4,000 cubic kilometres of fresh water a year, and agriculture takes around 70% of it, industry just under 20% and homes about 12%.

In 4.5 million births from 2020 to 2023 where the father's age was recorded, the average father was 29.5 and the median 29, usually two or three years older…
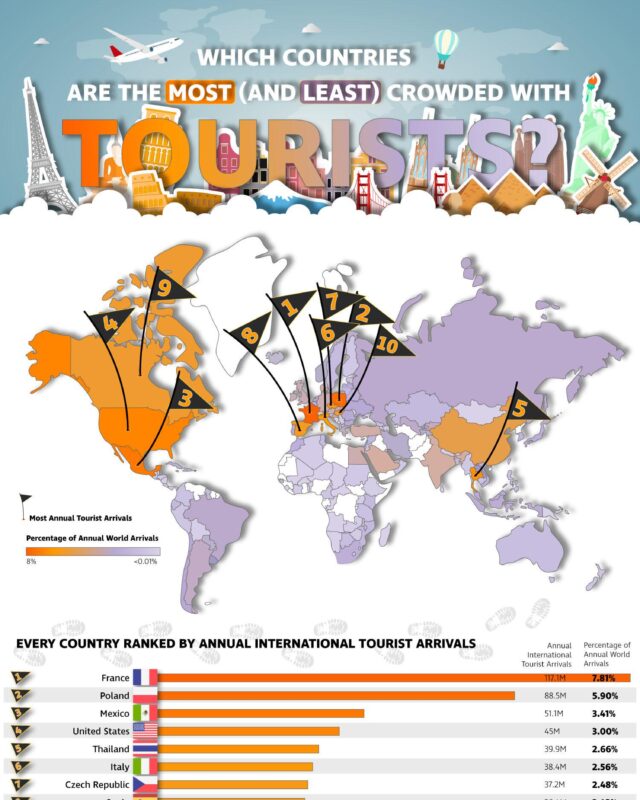
Turkey, Italy, Mexico, the UK, Germany, Japan and Greece complete the top 10.

Women outnumber men in 23 of the 27 EU countries.

M2 stood at $23.41 trillion in September 2026, a record high, after rising 5.7% over the previous 12 months, according to Federal Reserve data published on…

Russia had the highest rate of cat ownership at 57%.

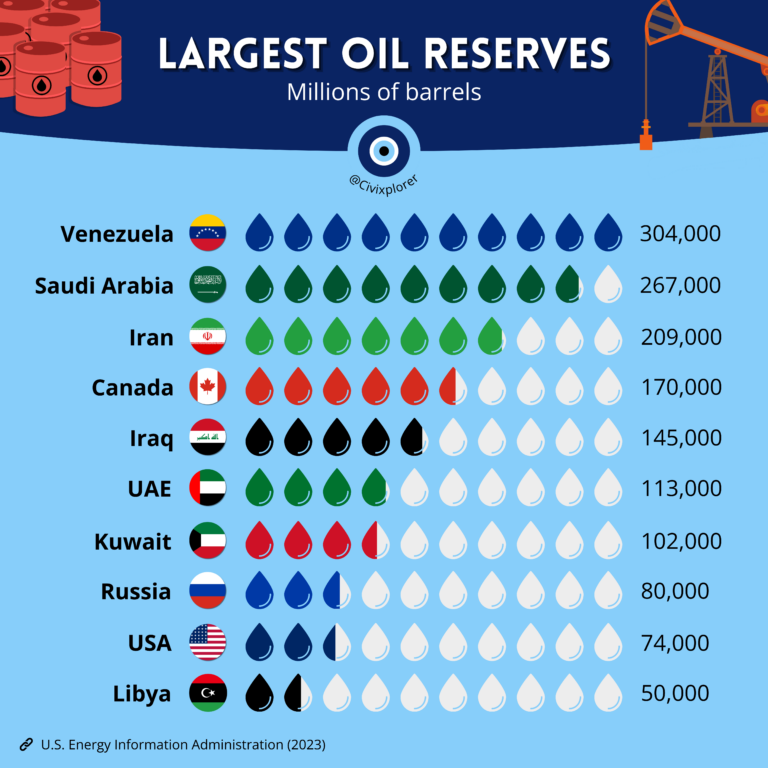
Energy Information Administration figures, followed by Saudi Arabia with 267 billion and Iran with 209 billion.

Currency etymology shows that most money names come from a few sources.
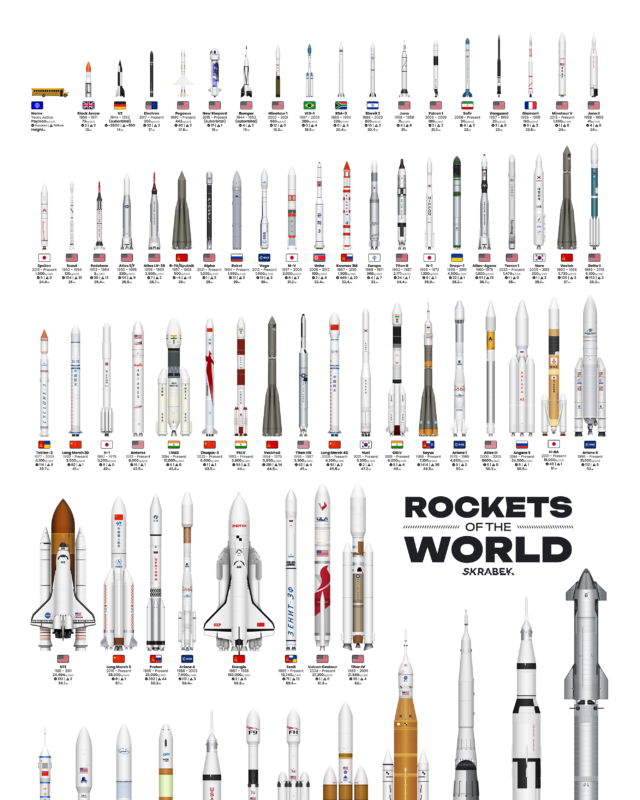
The biggest is SpaceX's Starship, 124.4 m tall, ahead of Saturn V at 111 m, while the smallest orbital rockets are under 20 m.

Measured by the share of each year's films tagged on IMDb, westerns, musicals and war films were big before 1960 and are now a tiny share of releases, while…

State rates range from about 26% in Colorado to almost 40% in Alabama, and the states with the most gyms per person, such as Massachusetts and Colorado,…

Africa is close behind, while Europe and North America show smaller falls, partly because much of their wildlife was lost before 1970.

A penalty is worth a fixed 0.79 xG in Opta's model and 0.76 in Wyscout's, reflecting the share of penalties that have historically been scored.
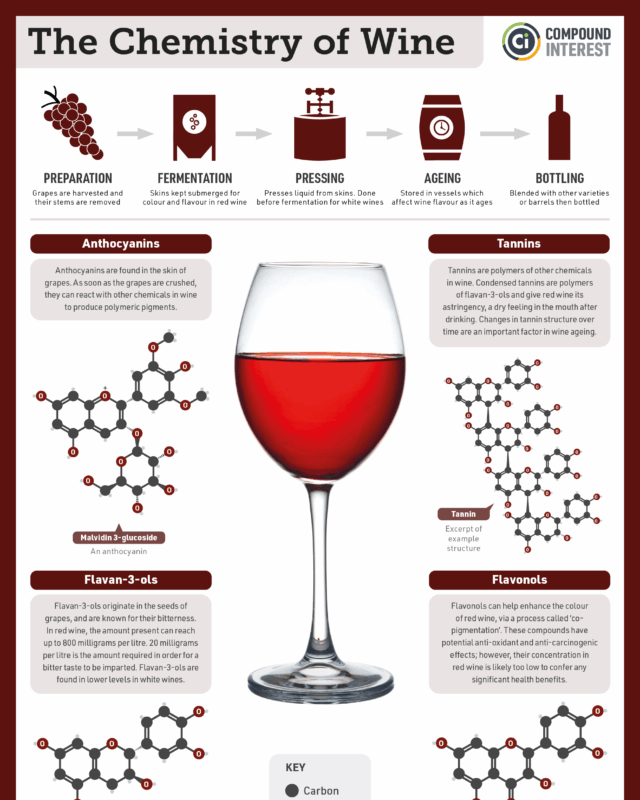
An average red wine ends up about 86% water and 12% alcohol, with small amounts of glycerol, acids, tannins and other phenolic compounds.

Zillow puts the typical US home at $366,157 in September 2026, up from $122,626 in January 2000, after a boom to 2007, a crash of about 24% to 2012 and a…
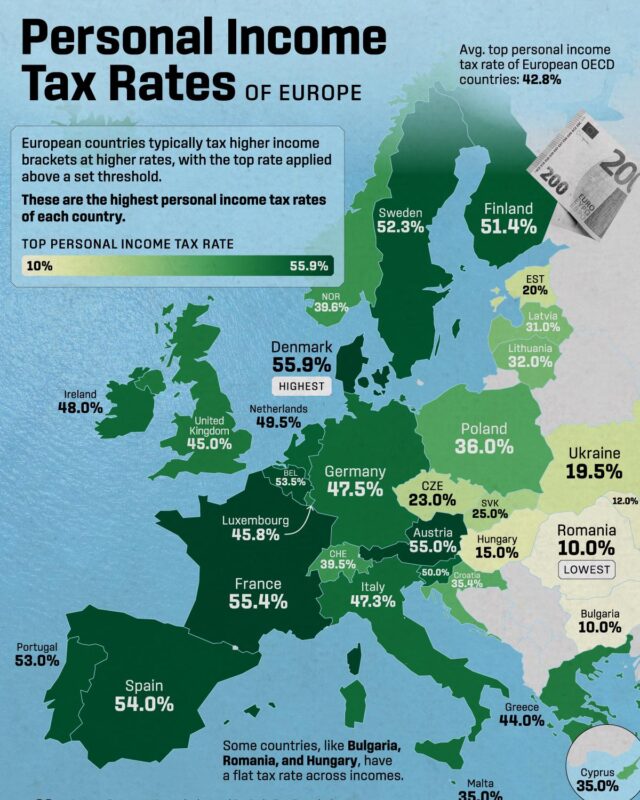
Denmark has the highest top rate of income tax at 60.5% in 2026, Belgium takes the most from an average worker's pay at 50.8%, and Hungary charges the…

In Brazil's Amazon, farmland grew from 12.9 million hectares in 1985 to 66.6 million in 2023, mostly cattle pasture, while forest shrank from 380 to 327…

Yearly totals stayed below 250 objects until 2017, then rose to 1,274 in 2020 and a record 4,510 in 2025, driven by commercial satellite internet…

The fleet runs from Landsat, first launched in 1972, and the Terra, Aqua and Aura flagships of 1999 to 2004 to newer missions such as SWOT, PACE and NISAR.
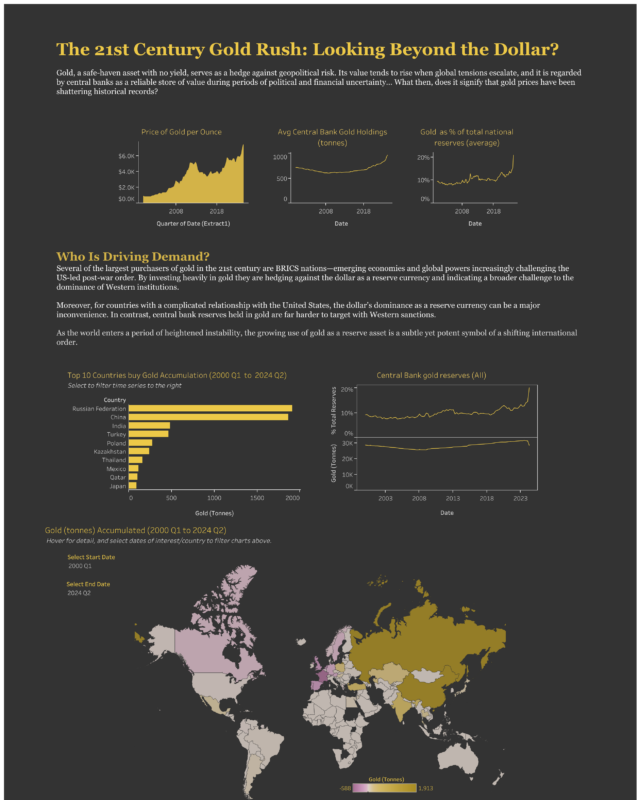
After selling gold in the 1990s, they have bought it every year since 2010 and more than 1,000 tonnes a year from 2022 to 2024, led over the period by…
Every topic page starts with a short guide to the subject.









Give it a permanent page where people looking for your subject find it, with your name and a link to your site. Content marketers, agencies, designers and researchers all list here.