
Environment and Energy
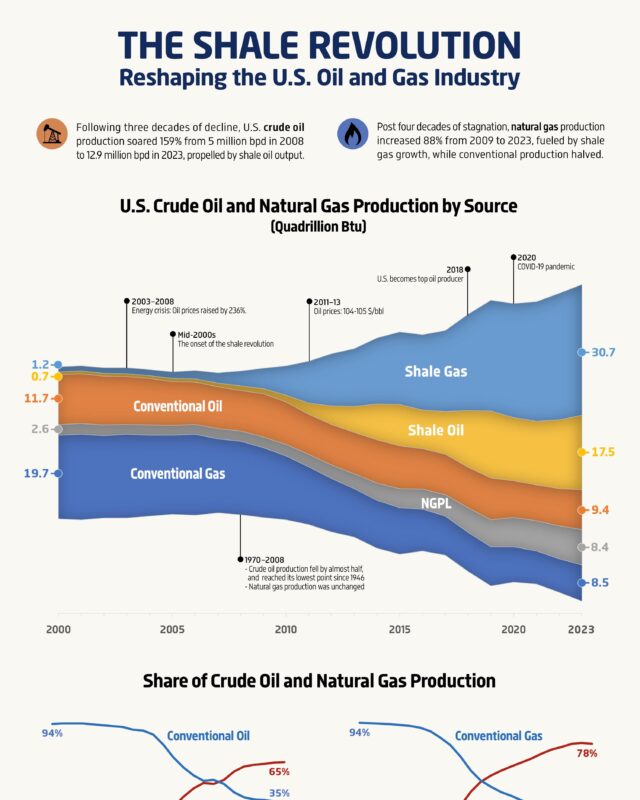
US Oil and Gas Production and the Shale Revolution, 2000 to 2023
Crude oil output rose 159% from 5 million barrels a day in 2008 to 12.9 million in 2023, and natural gas output rose 88% from 2009.
476 reviewed infographics. Search them, or narrow the list by topic and sort it the way you want.
Crude oil output rose 159% from 5 million barrels a day in 2008 to 12.9 million in 2023, and natural gas output rose 88% from 2009.

The United States led at 12,927 thousand barrels per day, and Texas alone, at 5,512, out-produced every country except Russia and Saudi Arabia.

The world produced 82,757 thousand barrels per day.

Nationally a year of income covers 20% of a home, about five years of income.

China bought 4,057 million barrels of crude that year, about 11.1 million barrels a day.

In the 12 months to November 2024 the US ran a $879 billion total deficit: a $1,171 billion shortfall on goods, partly offset by a $292 billion surplus on…

Asia grew from $96 billion to $18,793 billion and overtook Europe in 2010, lifting its share of global trade from 15% to 39% while Europe fell from 51% to 35%.

Their combined market value rose from $1.1 trillion in 2012 to $17.6 trillion at the end of 2024, a 26% annual rate.

It puts the 2023 US goods deficit at $1.15 trillion, against an EU surplus of $40 billion and China's surplus of $823 billion, and marks events from NAFTA…

Bitcoin accounted for $1,980 billion, about 54%, followed by other coins at $1,020 billion, Ethereum at $481 billion and stablecoins at $194 billion.

M2 money supply from 1970 to November 2024, with both rebased so the 1960s average equals 100.

All three rose to 2007, fell after the housing bubble burst and climbed sharply after 2020.

Software jobs grew from about 0.9 million to about 4.1 million, while hardware jobs fell from about 1.2 million to about 0.64 million and have been flat…

The ratio peaked around 2008, hit its low in April 2020 with gold at $1683 an ounce and oil at $21 a barrel, and stood 30% below its 1960s level in 2024.
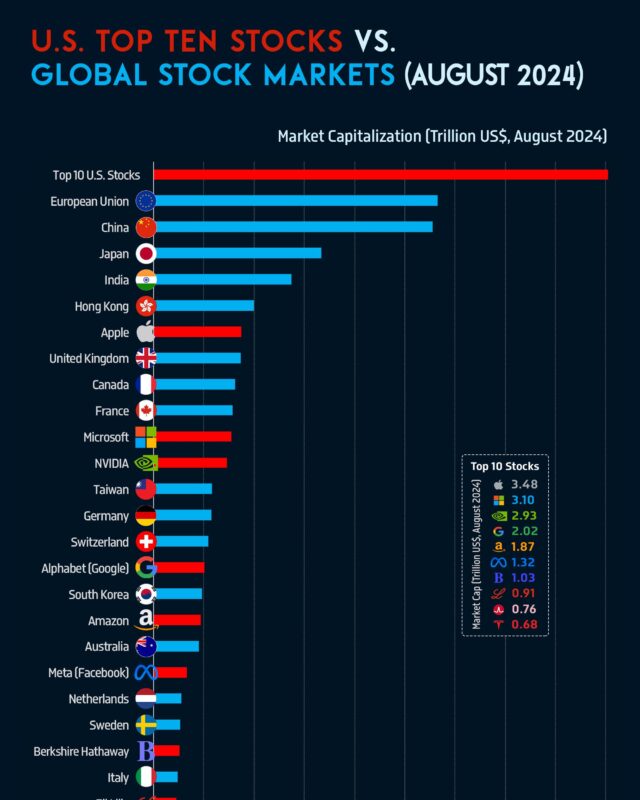
Together Apple, Microsoft, NVIDIA and seven others were worth $18.10 trillion, more than the whole stock market of the European Union or China.

It shows the married-couple share of US households falling from about 78% in 1950 to 47% in 2023, below half since about 2010.

The US median was about $440,000.

Global natural gas production was about 392.7 billion cubic feet a day in 2023, roughly 4,060 billion cubic metres a year, and reached 4.34 trillion cubic…

Germany, Japan, South Korea, Vietnam, Taiwan, India and Ireland complete the top ten, and the 27 EU countries together supplied more than any single country.

Goods alone ran a deficit of about $1.2 trillion.
Every topic page starts with a short guide to the subject.













Give it a permanent page where people looking for your subject find it, with your name and a link to your site. Content marketers, agencies, designers and researchers all list here.