

Finance and Economy
Digitally Delivered Services Exports Reached $4.3 Trillion
Exports grew from about $1.0 trillion to $4.3 trillion, an average of 8.2% a year.
476 reviewed infographics. Search them, or narrow the list by topic and sort it the way you want.
Exports grew from about $1.0 trillion to $4.3 trillion, an average of 8.2% a year.
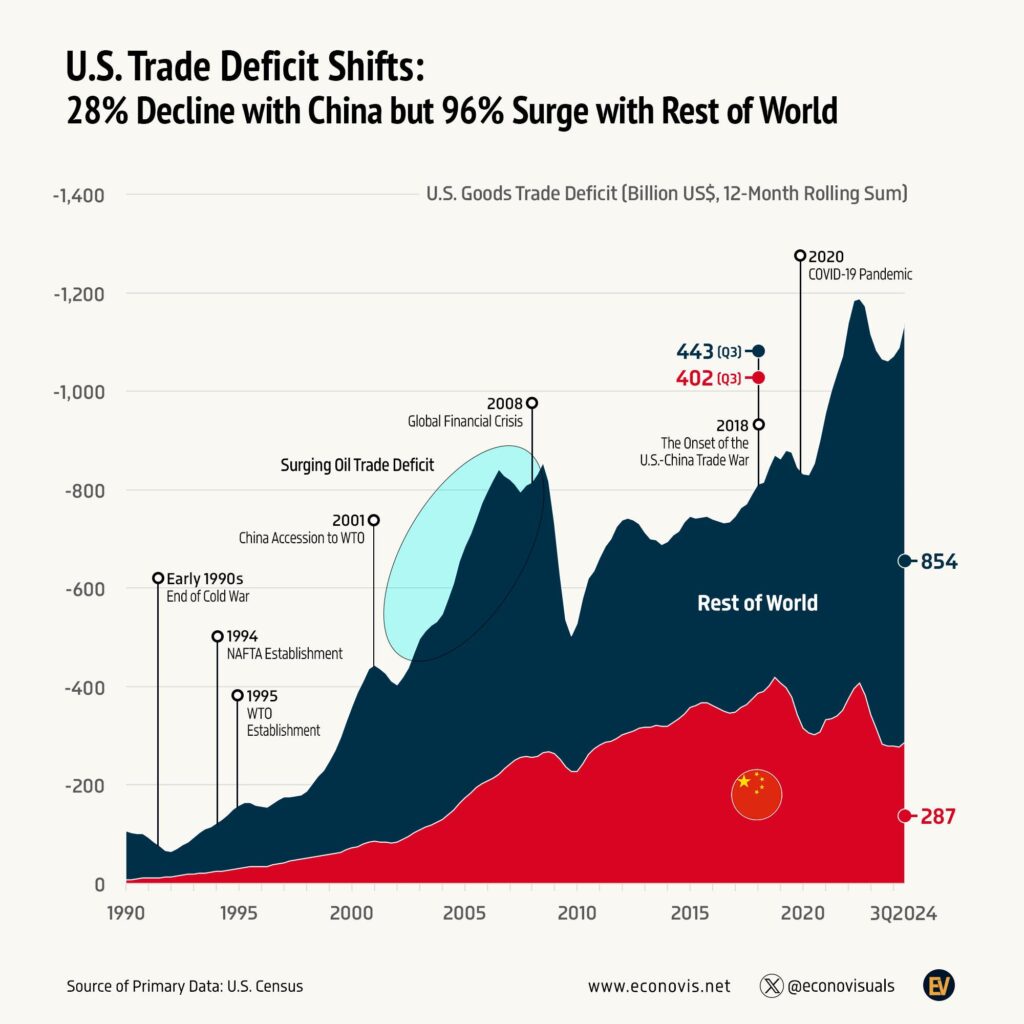
Since the 2018 trade war the deficit with China has fallen from $402 billion to $287 billion a year, while the deficit with other countries nearly doubled…

In the 12 months to November 2024 the US exported 4.17 million barrels a day and imported 6.58 million, a deficit of 2.40 million.
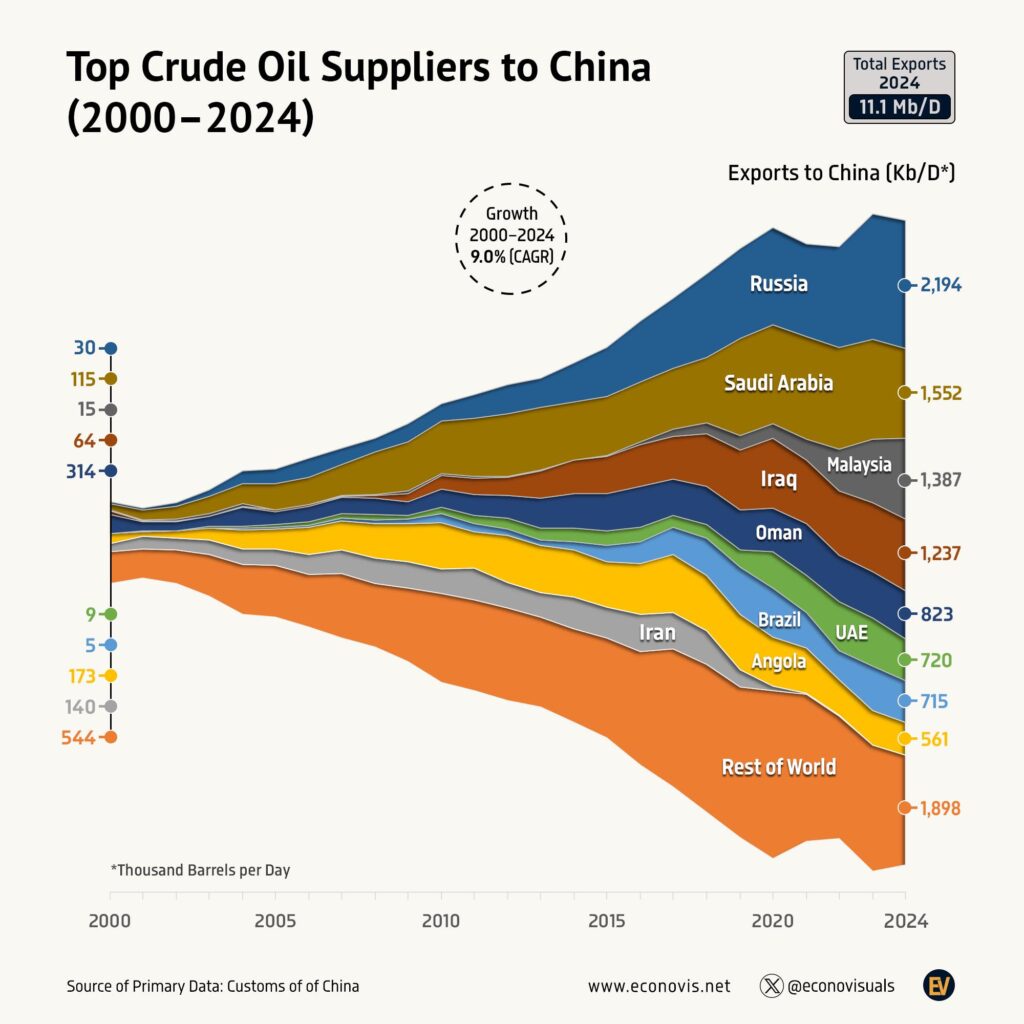
Imports grew from about 1.4 million to 11.1 million barrels a day, and Russia became the largest supplier at 2.19 million barrels a day, ahead of Saudi…
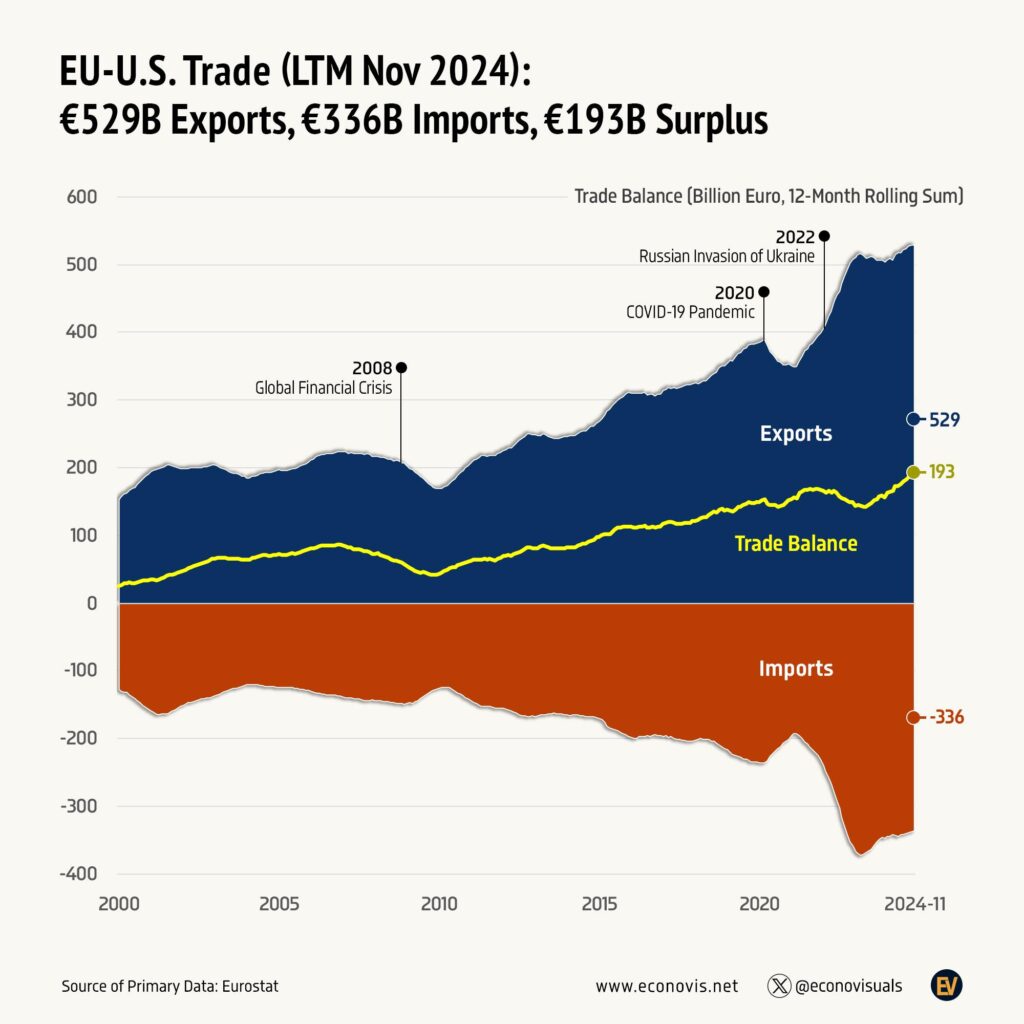
In the 12 months to November 2024 the EU exported €529 billion to the United States and imported €336 billion, a €193 billion surplus.
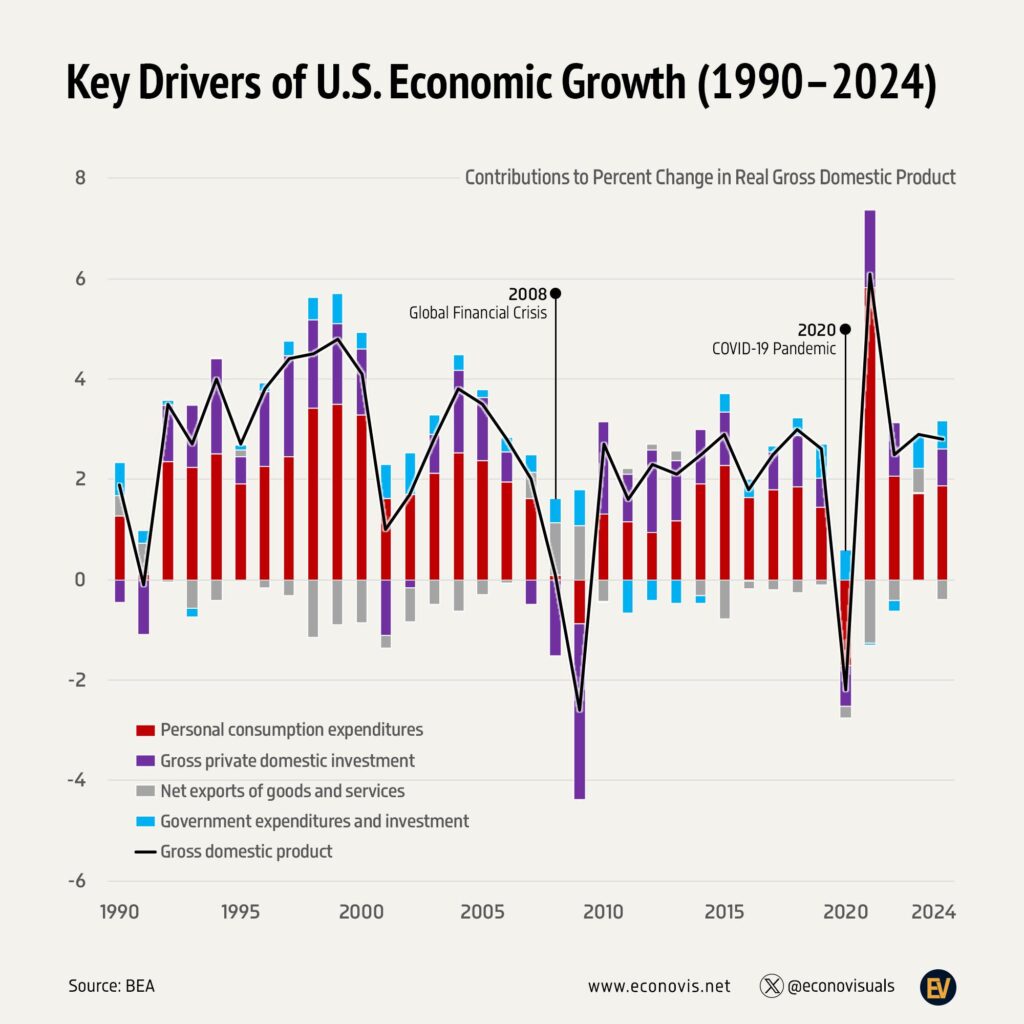
It supplied about 72% of real GDP growth from 1990 to 2024 and added to growth in 33 of those 35 years.
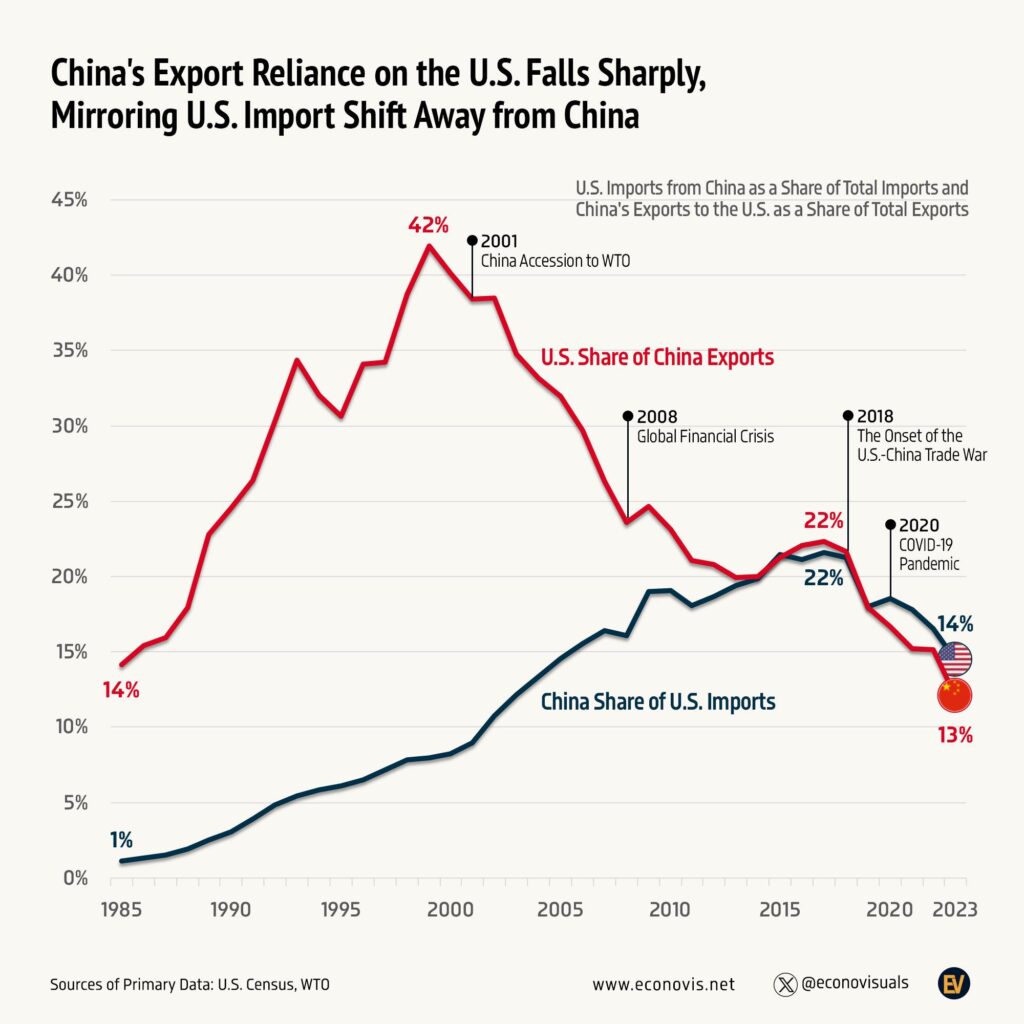
The US took 42% of China's exports at the 1999 peak but only 13% in 2023.
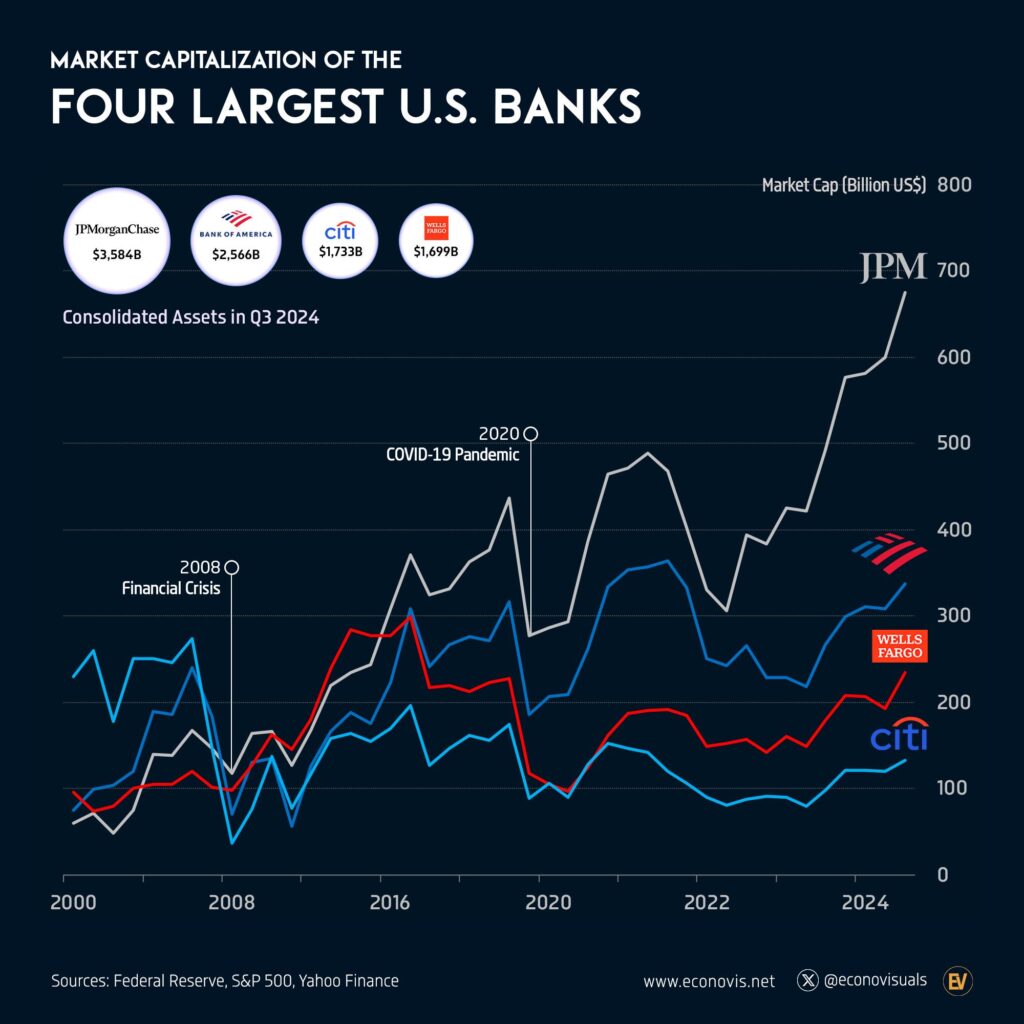
JPMorgan Chase finishes far ahead, while Citi falls from first in the early 2000s to last.
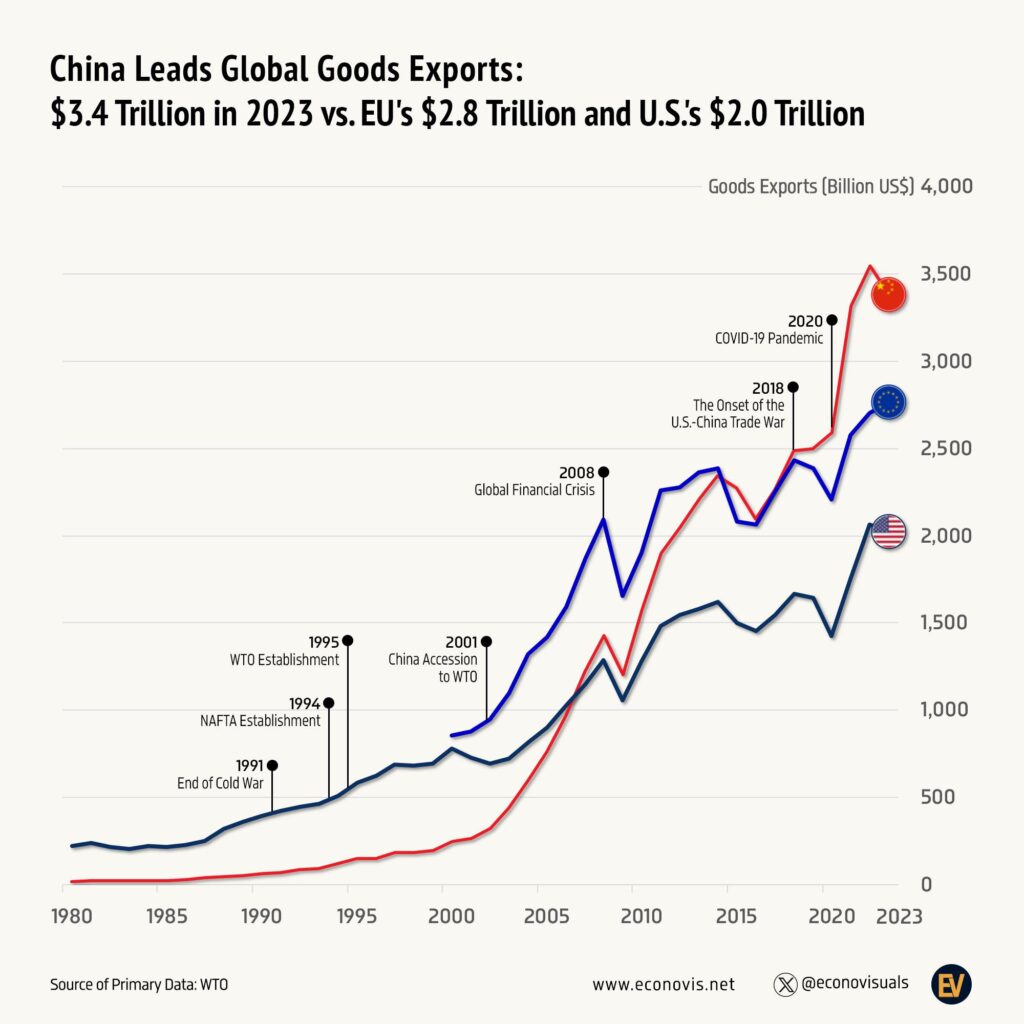
China exported $3.4 trillion of goods in 2023, ahead of the European Union at $2.8 trillion and the United States at $2.0 trillion, after growing about 12%…
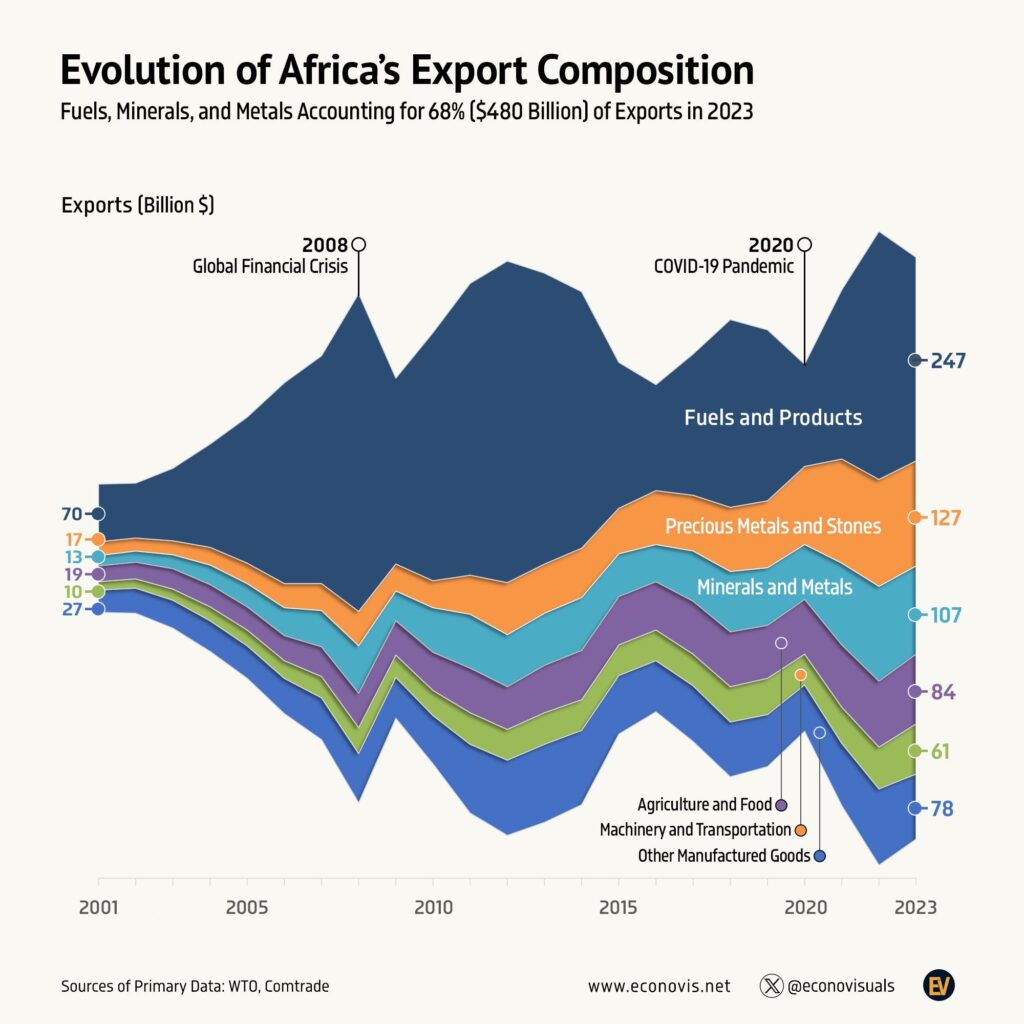
Fuels and related products led in 2023 at $247 billion, followed by precious metals and stones at $127 billion and other minerals and metals at $107 billion.
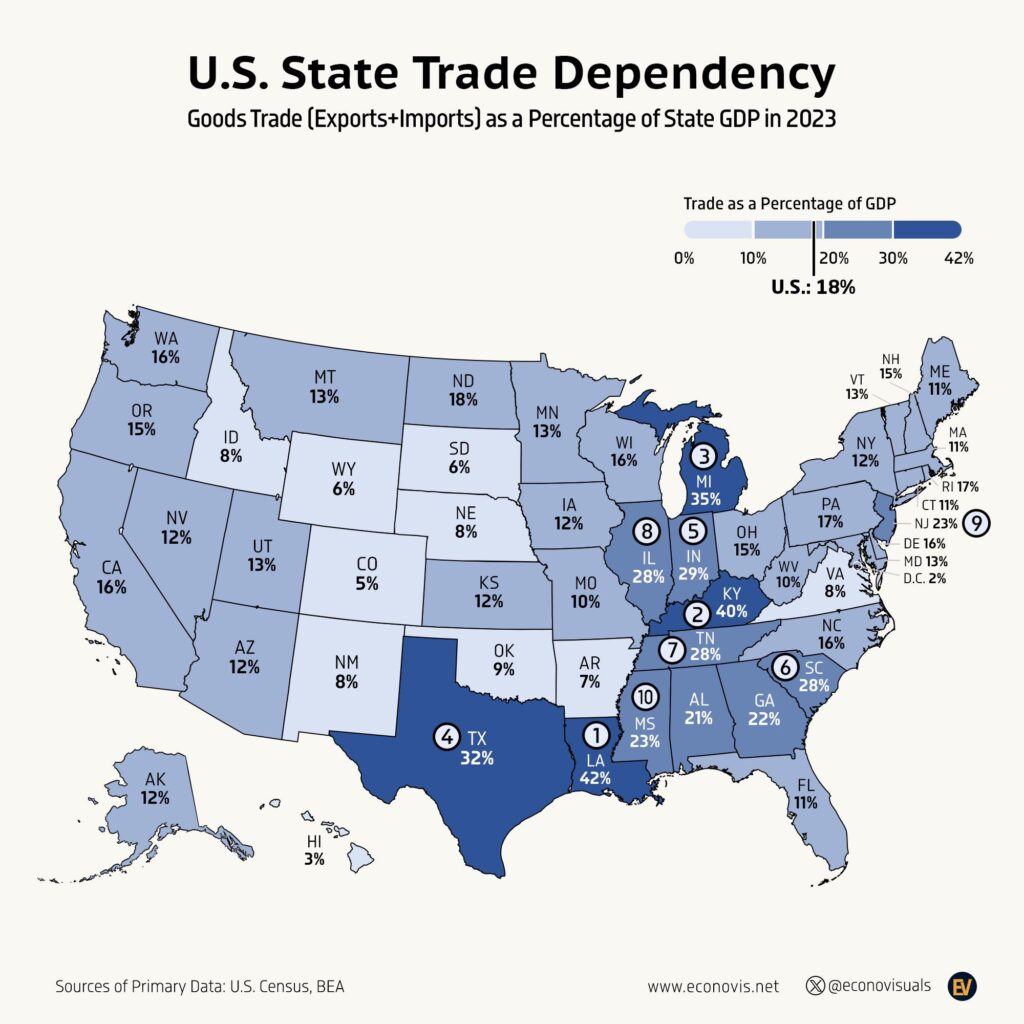
Louisiana is the most dependent at 42%, followed by Kentucky at 40% and Michigan at 35%, against 18% for the U.S. as a whole.
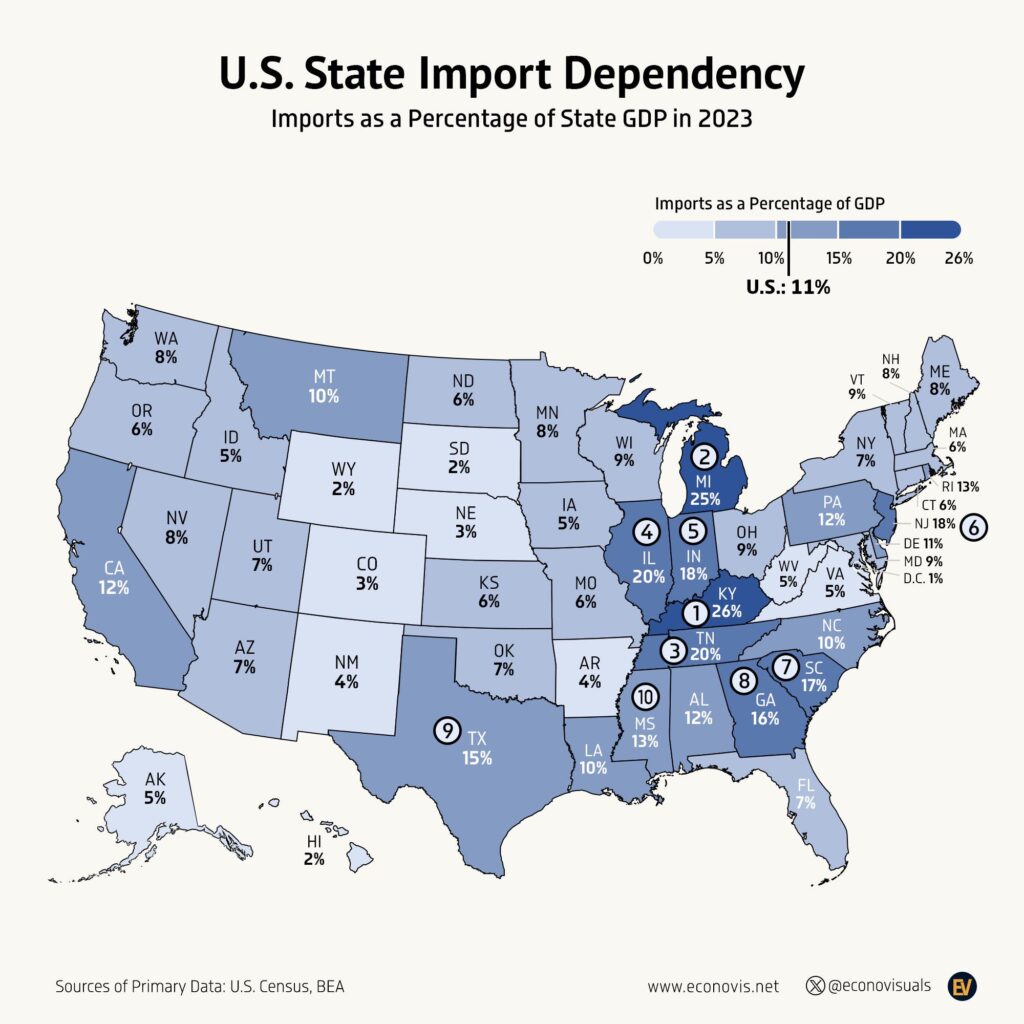
Kentucky is highest at 26%, ahead of Michigan at 25% and Tennessee and Illinois at 20%, against a national figure of 11%.
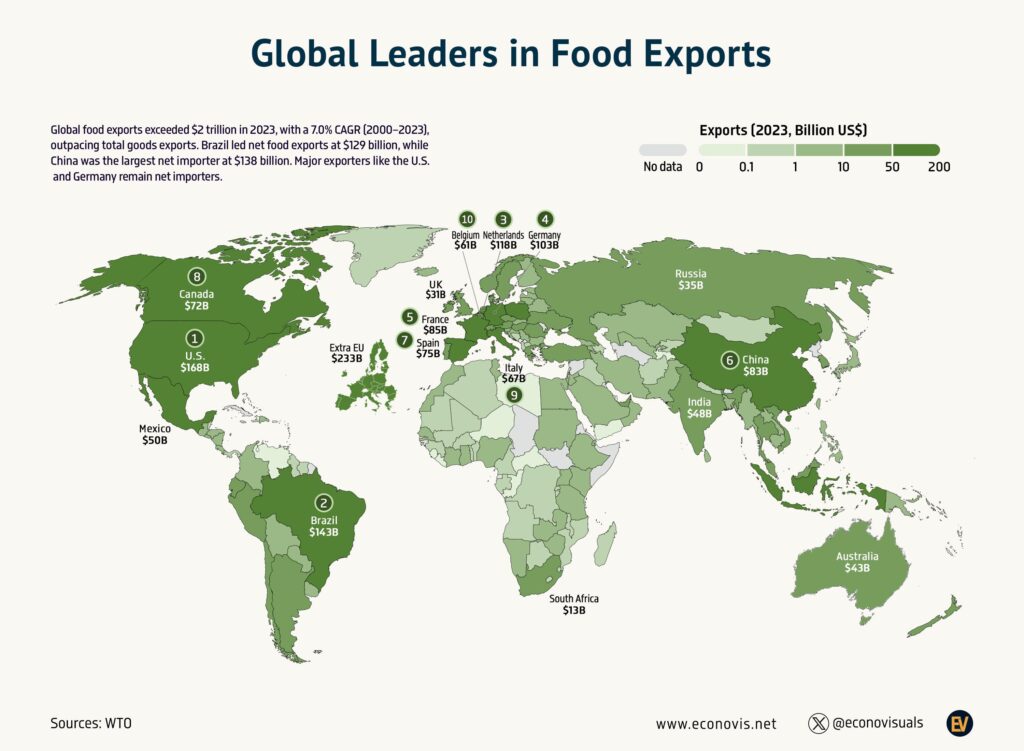
Brazil was second at US$143 billion and the Netherlands third at US$118 billion.
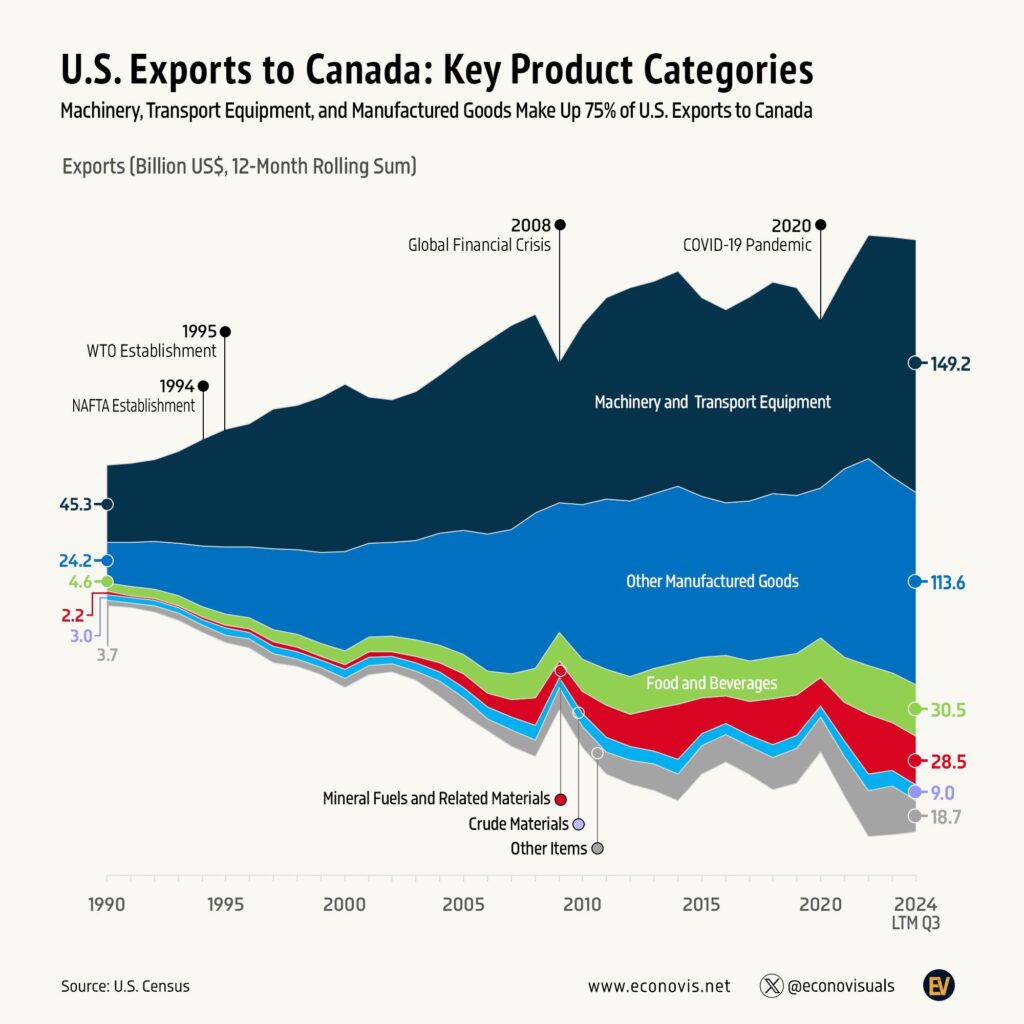
In the 12 months to the third quarter of 2024, machinery and transport equipment led at $149.2 billion, followed by other manufactured goods at $113.6…

In the 12 months to September 2024, mineral fuels led at $133.7 billion, ahead of other manufactured goods and machinery and transport equipment at about…
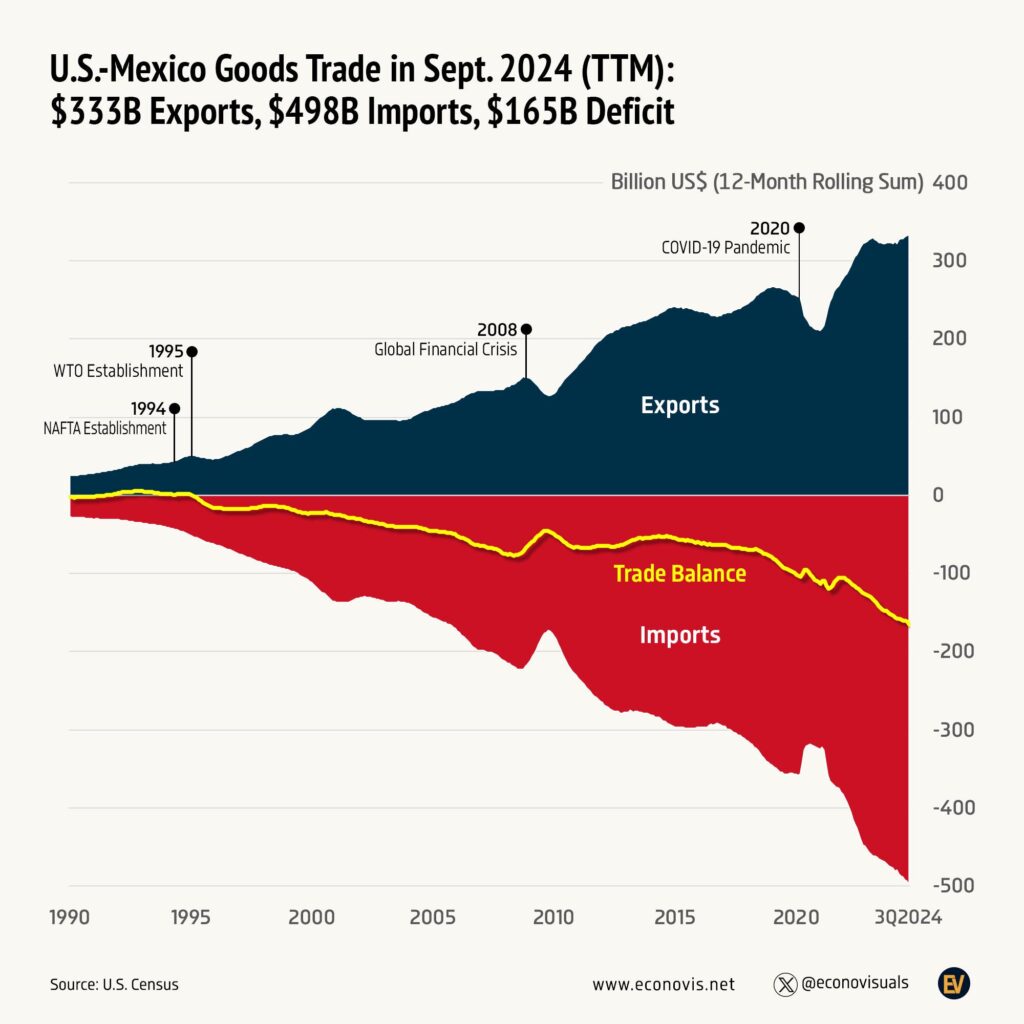
In the 12 months to September 2024, the US exported US$333 billion of goods to Mexico and imported US$498 billion, a US$165 billion deficit.
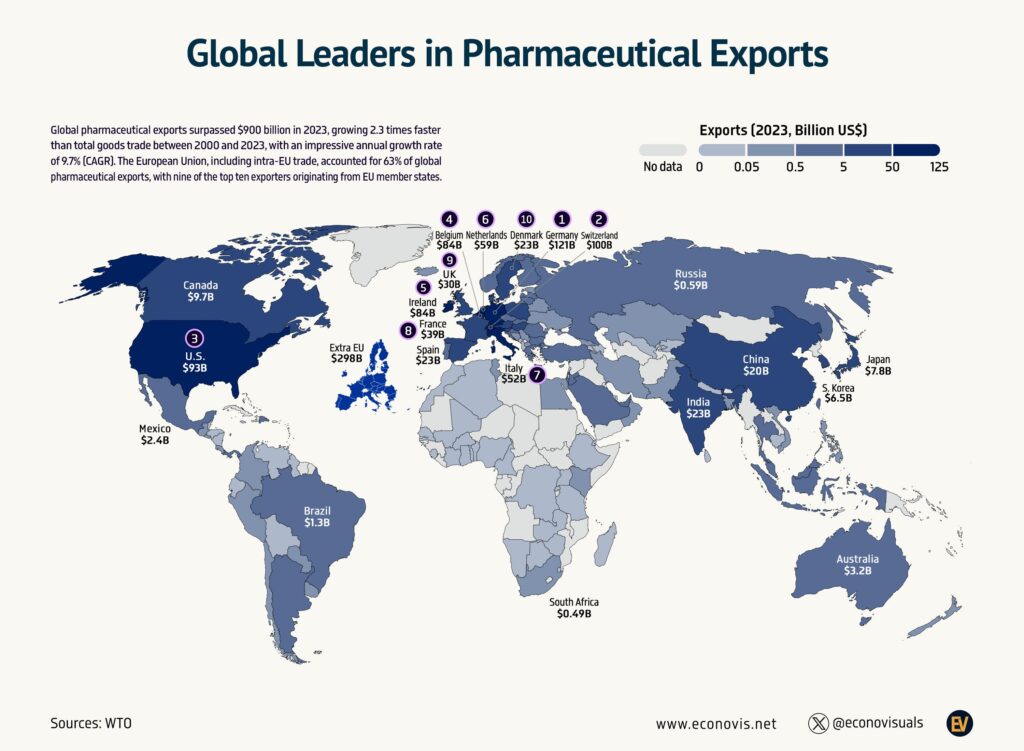
World pharmaceutical exports passed $900 billion that year.
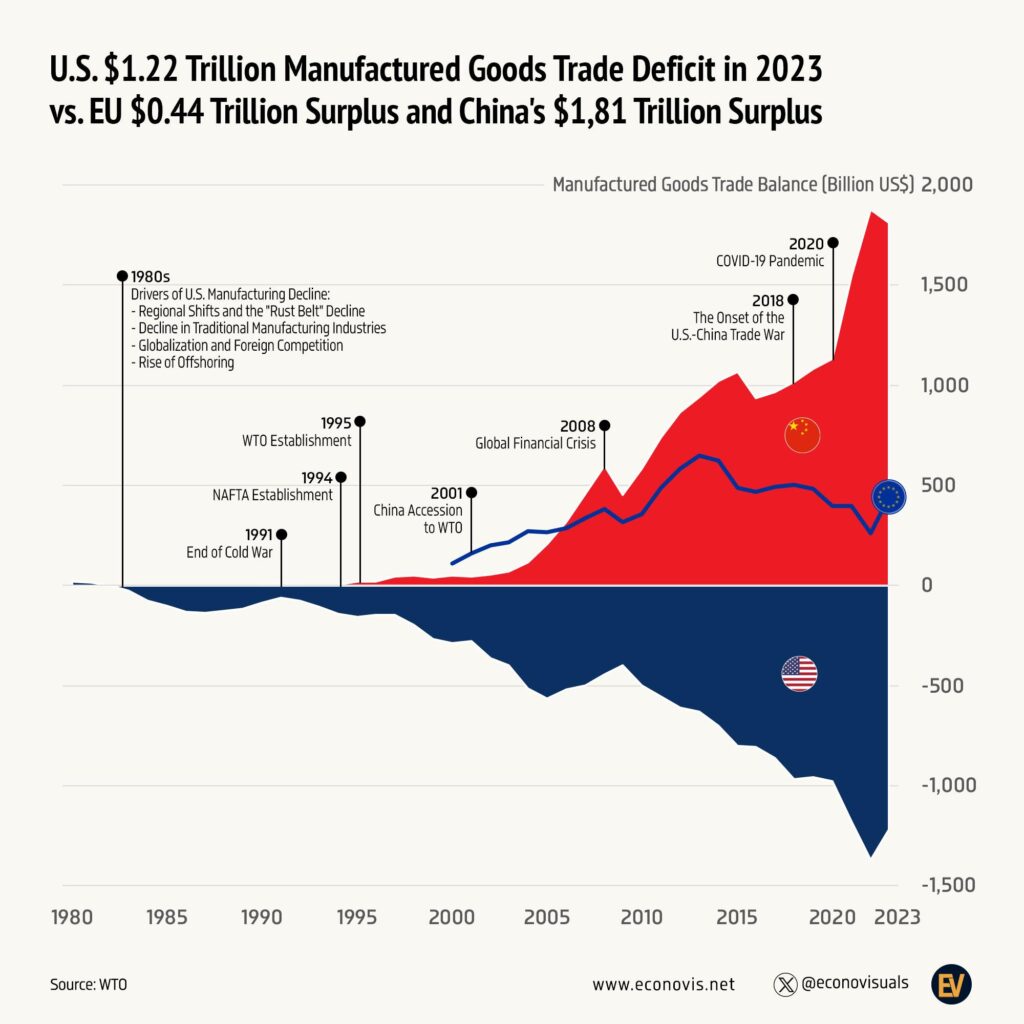
This Econovis chart sets the US manufactured goods trade deficit of $1.22 trillion in 2023 against China's $1.81 trillion surplus and the EU's $0.44…

Sales boomed to a peak of 74,300 in 2022, then fell back to about 23,800.
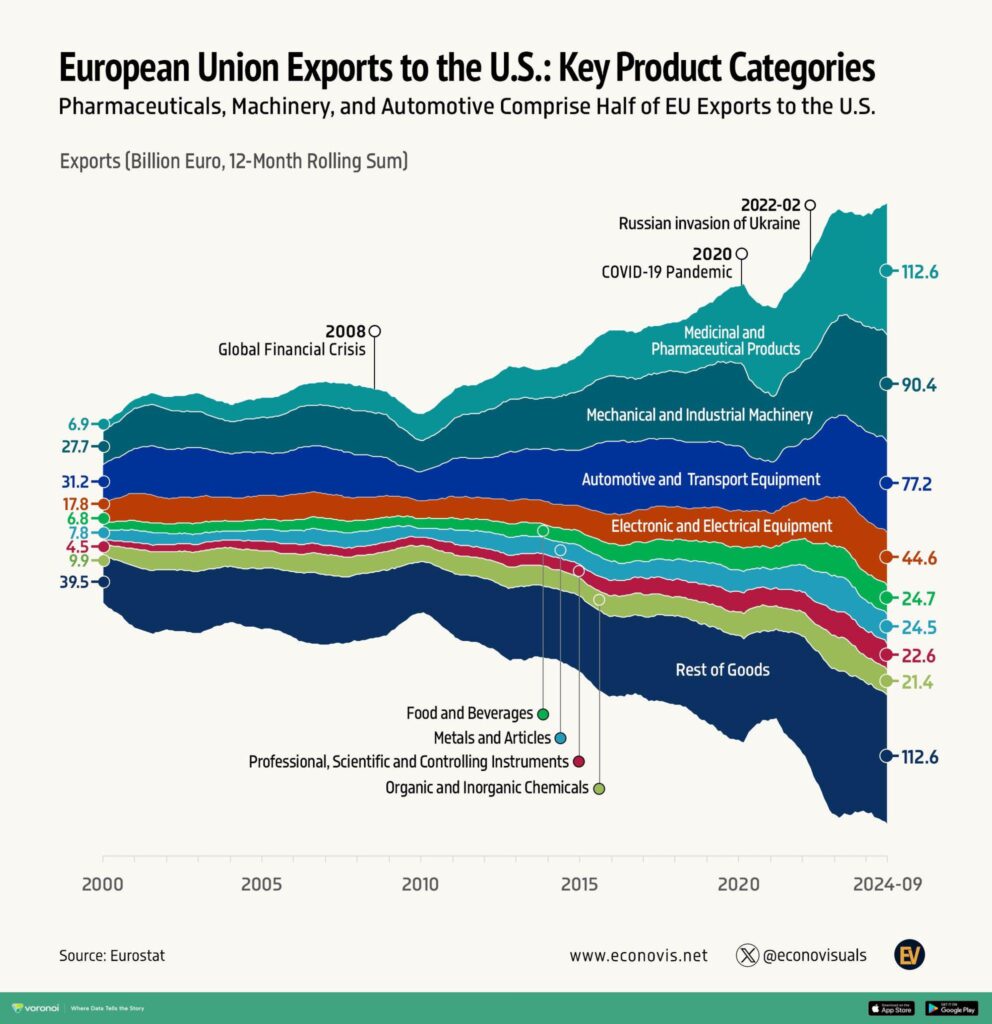
Pharmaceuticals grew from €6.9 billion to €112.6 billion and, with machinery (€90.4 billion) and vehicles (€77.2 billion), now make up about half of EU…
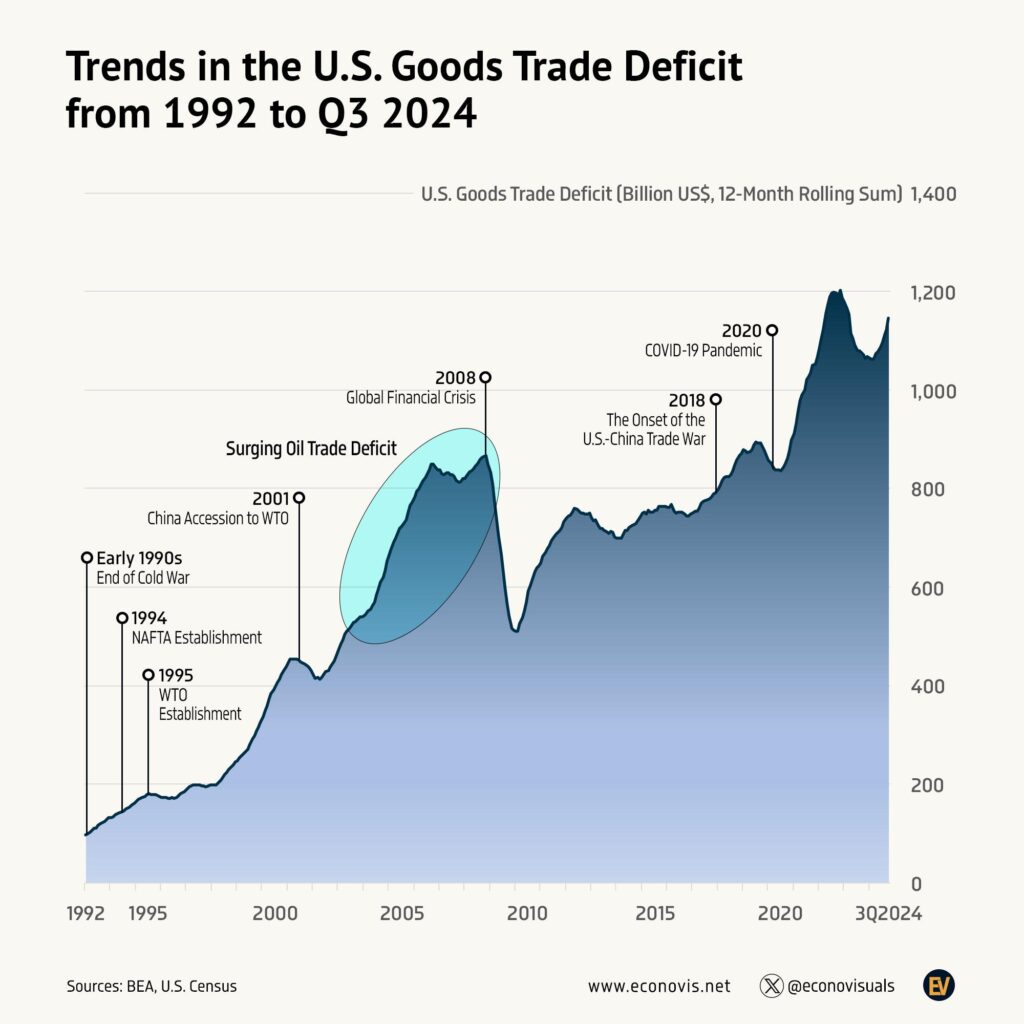
It grew from about $97 billion in 1992 to a peak of about $1.2 trillion in 2022, with sharp drops in 2001 and 2009.

In 2023 services made up 25% of world exports.
Every topic page starts with a short guide to the subject.
















Give it a permanent page where people looking for your subject find it, with your name and a link to your site. Content marketers, agencies, designers and researchers all list here.