



Trade
US Trade Deficit vs EU and China Goods Balances, 1980 to 2023
That was a $1,259.6 billion deficit in goods, partly offset by a $327.7 billion surplus in services.
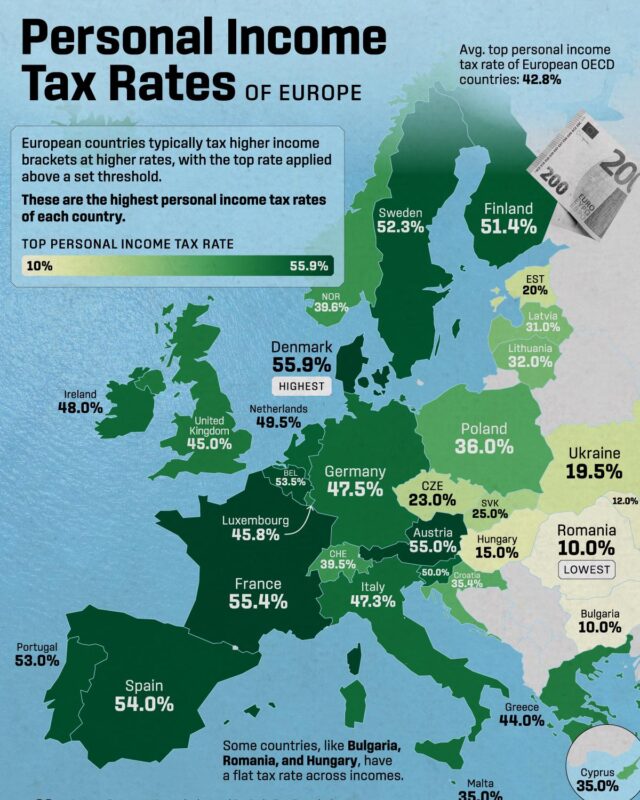
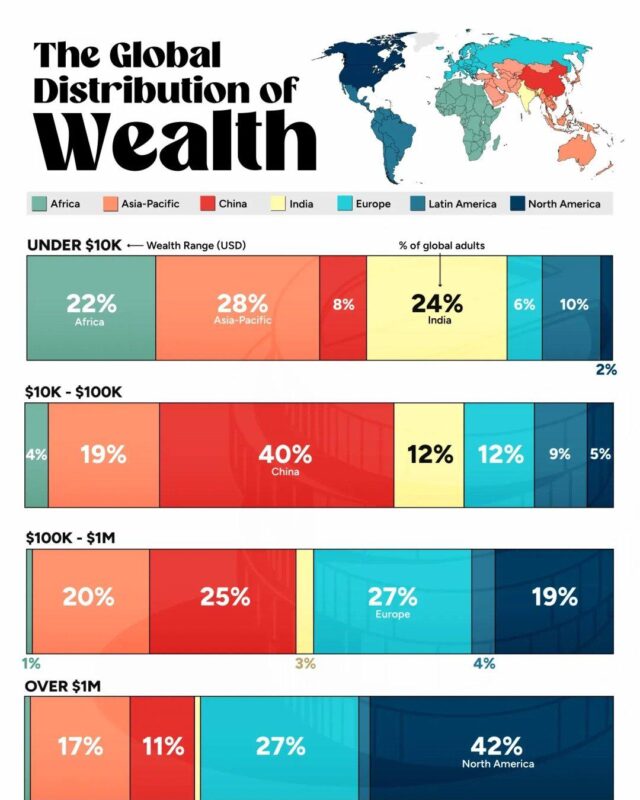
This hub collects our economics and personal finance infographics, including GDP and growth, inflation, money supply, gold and the cost of living, plus sections for trade, stock markets, wealth and income, housing and taxes. Every page shows the original graphic with its creator credited, a complete text version of the data and notes on where the figures come from. Good places to start are US inflation rate history by year, Turkey GDP per capita by province, the top 10 US stocks compared with global stock markets, top personal income tax rates in Europe and global wealth distribution by region. Where a graphic has dated or disputed numbers, the page says so and gives the current figure.
That was a $1,259.6 billion deficit in goods, partly offset by a $327.7 billion surplus in services.

In 2024 İstanbul had the highest GDP per capita of Turkey's 81 provinces, at about $24,450, while Şanlıurfa had about $5,730, less than a quarter as much.

Machinery, cars and car parts and electrical equipment make up about 38% of the total, followed by fuels, plastics, scientific instruments, aircraft parts,…

Crude oil, natural gas and other fuels make up about 30% of the total, followed by cars and car parts, machinery, plastics, gold, lumber and aluminium.

The US exported $337.3 billion of goods to Mexico and imported $534.3 billion, leaving a deficit of $197.0 billion.
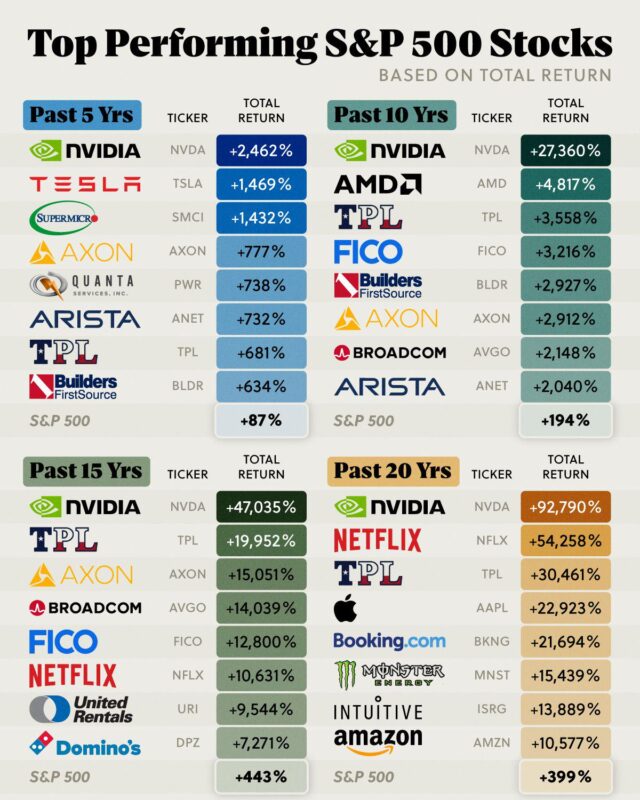
To 30 November 2024 its total return was +2,462% over five years and +92,790% over twenty, so $1,000 invested in late 2004 would have grown to about $929,000.

It exported $121 billion of medicines and pharmaceutical products in 2023 on WTO figures, ahead of Switzerland at $100 billion and the United States at $93…

In the first nine months of 2026 it was $131.5 billion.

A record 1.69 million homes were sold in 2025, yet prices rose 22.3% in the year to September 2026 while inflation ran at 29.7%, a real fall of about 5.7%.
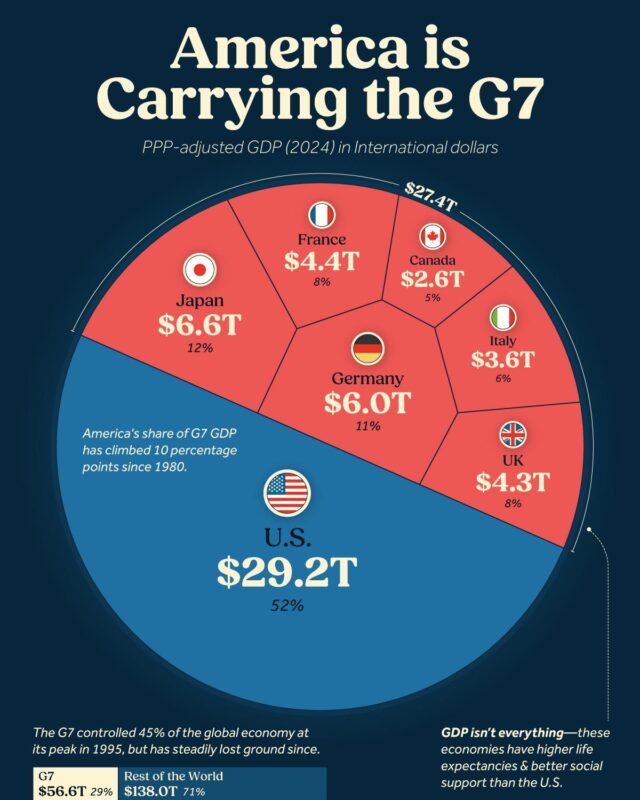
The United States accounts for more than half of it on both measures, and the group's share of the world economy has fallen from over half in the 1980s to…

European Union exports to the US came to €554.7 billion of goods in 2025, about 21% of everything the EU sells outside the bloc, which makes the US its…

That is about 41% below the record of $4.28 trillion set in October 2025.
The 113 infographics here fall into a few groups. On the wider economy there are inflation by year, GDP per capita and growth forecasts, and what drives US growth. On trade there are export rankings, US trade with Canada, China and Colombia, and oil reserves and oil flows. Others cover stock market values and money supply, wealth, income and poverty, government revenue, spending and tax rates, and prices from electricity to rare materials.
For forecasts, GDP Growth by Country, Real Growth Estimates Over 10 Years by Visual Capitalist puts India first at 6.3% a year, while Germany and Italy are expected to shrink by 0.5% a year. For public finances, the USAFacts chart US Tax Revenue 2024 and Federal Spending in One Chart shows the government took in $4.9 trillion in fiscal year 2024 and spent $6.8 trillion, leaving a $1.8 trillion deficit. Net interest on debt ($878 billion) was slightly larger than National Defense ($877 billion).
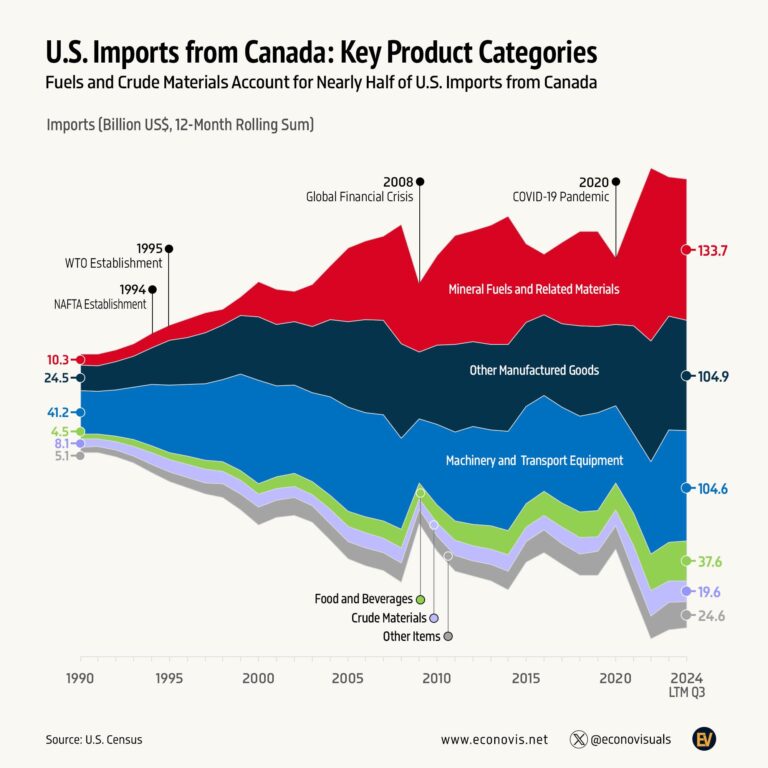
Two Econovis charts work as a pair. What Does the US Import From Canada, 1990 to 2024 shows mineral fuels leading at $133.7 billion in the 12 months to September 2024, and US Exports to Canada, Six Product Categories Since 1990 shows machinery and transport equipment leading the other way at $149.2 billion in the 12 months to the third quarter of 2024.
On wealth, Visual Capitalist's Median Wealth by Country vs Average Wealth, Top 20 uses UBS Global Wealth Report 2024 figures to show the United States fourth for average wealth ($565,000) but 14th for median wealth ($112,000). For markets, S&P 500 vs M2 Money Supply Chart, 1970 to 2024 by Ehsan Soltani of Econovis finds that since the 1960s M2 grew about 48 times and the S&P 500 about 74 times.
The Housing, Stock Market, Taxes and Public Spending, Trade, and Wealth and Income sections group these graphics by subject.
Venezuela, with 304,000 million barrels of proven oil reserves, according to the Civixplorer chart Largest Oil Reserves by Country, which uses U.S. Energy Information Administration figures for 2023. Saudi Arabia (267,000) and Iran (209,000) are second and third.
Senator Rick Scott, at an estimated US$327 million, in the Carbon Finance chart Richest Members of Congress, which uses Quiver Quantitative data as of 27 July 2024. Vern Buchanan (US$249 million) and Nancy Pelosi (US$248 million) follow.
Each page writes out the graphic in full text and checks its claims against the sources listed on the page. Where a figure is wrong or out of date, a note corrects it, as on US Inflation Rate History by Year, 1914 to 2023, where every yearly figure is checked against the source data and the Minneapolis Fed.
Give it a permanent page where people looking for your subject find it, with your name and a link to your site. Content marketers, agencies, designers and researchers all list here.